Copyright
©The Author(s) 2017.
World J Gastroenterol. Jun 21, 2017; 23(23): 4233-4242
Published online Jun 21, 2017. doi: 10.3748/wjg.v23.i23.4233
Published online Jun 21, 2017. doi: 10.3748/wjg.v23.i23.4233
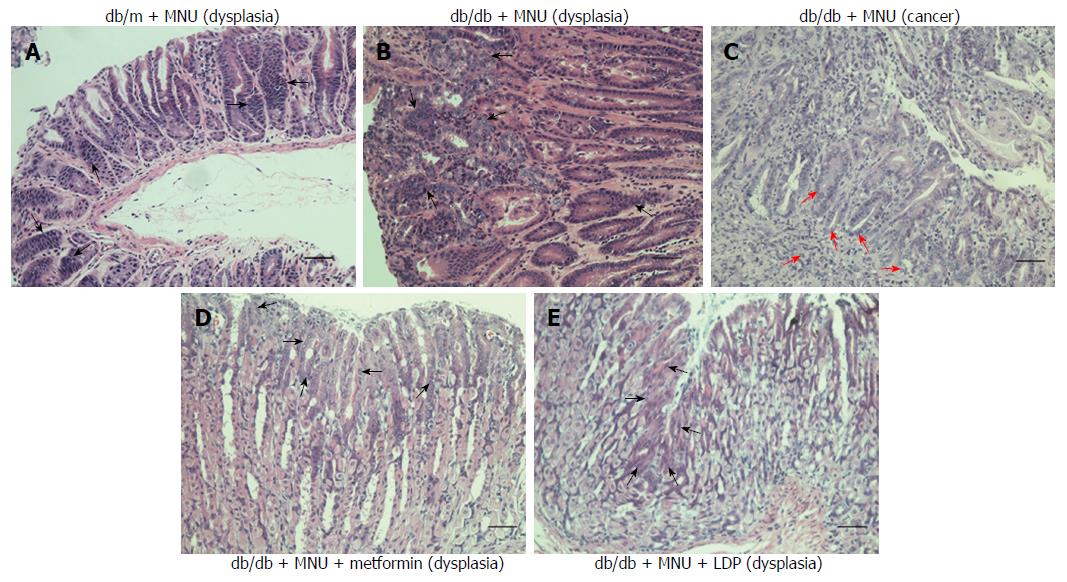
Figure 1 Hematoxylin and eosin staining of stomach tissue.
A: Gastric dysplasia in non-diabetic control group (db/m); B: Gastric dysplasia in diabetic control group (db/db); C: Gastric cancer in diabetic control group (db/db); D: Gastric dysplasia in metformin-treated group (db/db); E: Gastric dysplasia in LDP-treated group (db/db). The black arrows indicate cell dysplasia with irregular and hyperchromatic cell nuclei. The red arrows show invasive gastric cancer cells in the submucosa. Bar represents 50 μm. LDP: Liuwei Dihuang Pill; MNU: N-methyl-N-nitrosourea.
- Citation: Zhuang S, Jian YM, Sun YN. Inhibition of N-methyl-N-nitrosourea-induced gastric tumorigenesis by Liuwei Dihuang Pill in db/db mice. World J Gastroenterol 2017; 23(23): 4233-4242
- URL: https://www.wjgnet.com/1007-9327/full/v23/i23/4233.htm
- DOI: https://dx.doi.org/10.3748/wjg.v23.i23.4233


