Copyright
©The Author(s) 2017.
World J Gastroenterol. Jun 7, 2017; 23(21): 3839-3849
Published online Jun 7, 2017. doi: 10.3748/wjg.v23.i21.3839
Published online Jun 7, 2017. doi: 10.3748/wjg.v23.i21.3839
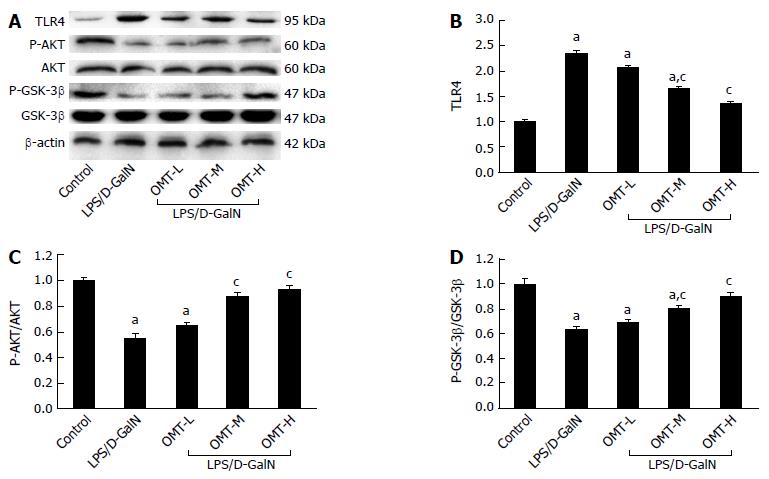
Figure 6 The expression of TLR4, AKT, P-AKTSer473, GSK3β and P-GSK3βSer9 in each group.
A: Representative western blot analysis of TLR4, AKT, P-AKTSer473, GSK3β and P-GSK3βSer9 protein; B: Quantitative analysis of TLR4. β-actin was used as an internal control; C: Quantitative analysis of P-AKTSer473/AKT; D: Quantitative analysis of P-GSK3βSer9/GSK3β. The total AKT and GSK3β were used as a control. aP < 0.05, vs control group; cP < 0.05, vs LPS/D-GalN group. D-GalN: D-galactosamine; LPS: Lipopolysaccharide; OMT: Oxymatrine.
- Citation: Zhang X, Jiang W, Zhou AL, Zhao M, Jiang DR. Inhibitory effect of oxymatrine on hepatocyte apoptosis via TLR4/PI3K/Akt/GSK-3β signaling pathway. World J Gastroenterol 2017; 23(21): 3839-3849
- URL: https://www.wjgnet.com/1007-9327/full/v23/i21/3839.htm
- DOI: https://dx.doi.org/10.3748/wjg.v23.i21.3839


