Copyright
©The Author(s) 2017.
World J Gastroenterol. Jan 14, 2017; 23(2): 286-296
Published online Jan 14, 2017. doi: 10.3748/wjg.v23.i2.286
Published online Jan 14, 2017. doi: 10.3748/wjg.v23.i2.286
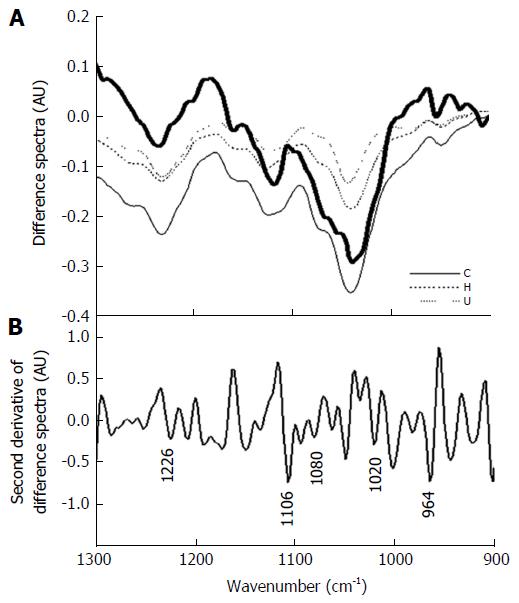
Figure 5 Extrapolation of the principle/observations to disease conditions.
A: Difference spectra between normal, IBD (Crohn's-H and Ulcerative colitis-UC) and cancer (C) tissues showing similar pattern to the difference spectra obtained by subtracting normalized spectra with apertures 120 and 90 μm (bold black line); B: Second derivative of the difference spectra of 120 and 90 μm showing peaks corresponding to nucleic acid absorbance (DNA-1020, 1080, 964). The difference spectra of IBD, normal and Crohn’s represent the average spectra for each category from ten different patients subtracted from the average normal spectra.
- Citation: Sahu RK, Salman A, Mordechai S. Tracing overlapping biological signals in mid-infrared using colonic tissues as a model system. World J Gastroenterol 2017; 23(2): 286-296
- URL: https://www.wjgnet.com/1007-9327/full/v23/i2/286.htm
- DOI: https://dx.doi.org/10.3748/wjg.v23.i2.286


