Copyright
©The Author(s) 2017.
World J Gastroenterol. Jan 14, 2017; 23(2): 286-296
Published online Jan 14, 2017. doi: 10.3748/wjg.v23.i2.286
Published online Jan 14, 2017. doi: 10.3748/wjg.v23.i2.286
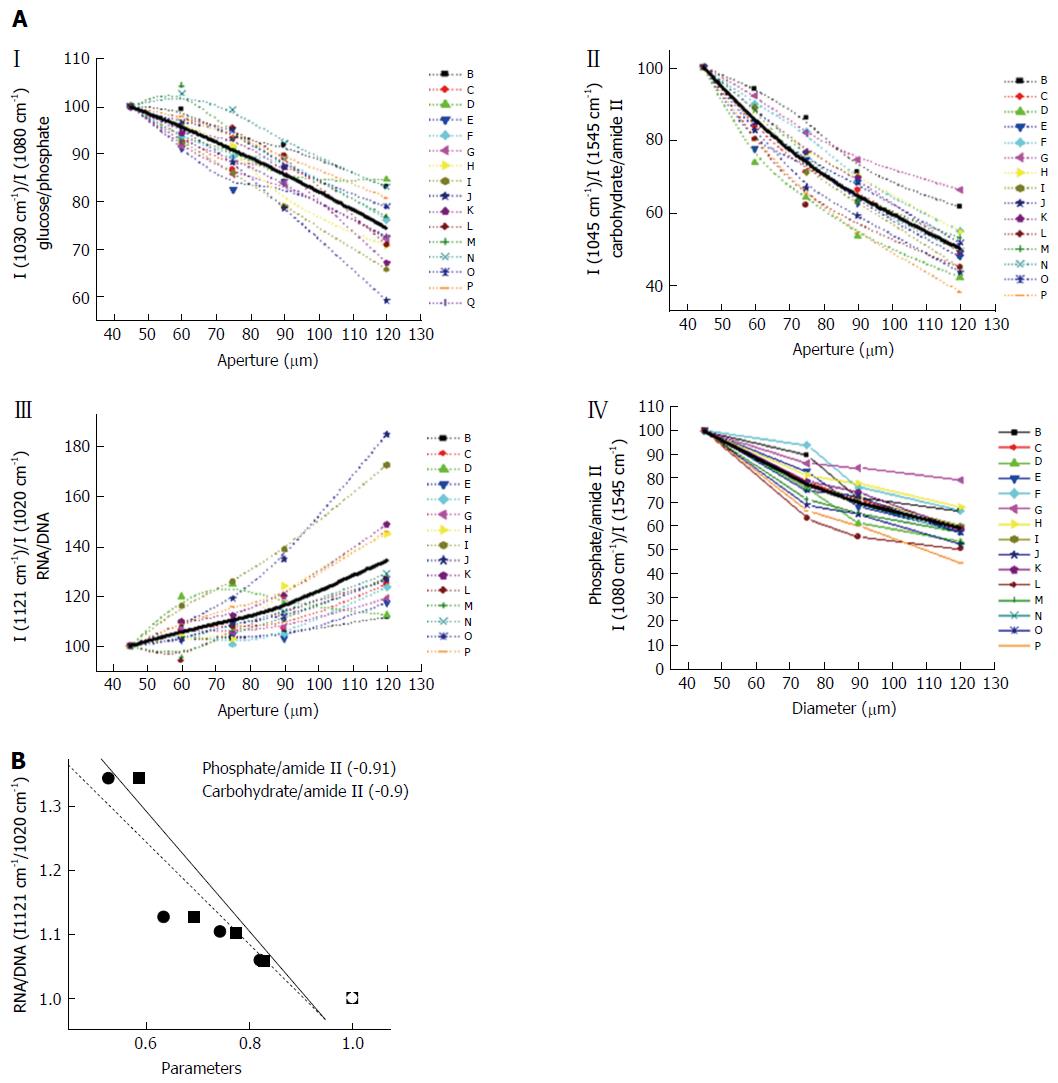
Figure 4 Analysis of different parameters to indicate the changes in composition within a crypt.
A: Distribution of different metabolites in the various zones: Glucose/phosphate [I (1030 cm-1)/I (1080 cm-1)], Carbohydrates/amide II [I (1045 cm-1)/I (1545 cm-1)], RNA/DNA [I (1121 cm-1)/I (1020 cm-1)], and Phosphate/amide II [I (1080 cm-1)/I (1545 cm-1)]. Each line represents a crypt and the dark line represents the average. A few crypts are shown along with the averages to indicate the pattern; B: Correlation between different parameters (Solid square-phosphate/amide II and solid circle-carbohydrate/amide II) and the RNA/DNA ratio along the crypt. The lines are only an indicator of the trends. The values within the box indicate the correlation coefficients of the different parameters with the RNA/DNA ratio.
- Citation: Sahu RK, Salman A, Mordechai S. Tracing overlapping biological signals in mid-infrared using colonic tissues as a model system. World J Gastroenterol 2017; 23(2): 286-296
- URL: https://www.wjgnet.com/1007-9327/full/v23/i2/286.htm
- DOI: https://dx.doi.org/10.3748/wjg.v23.i2.286


