Copyright
©The Author(s) 2017.
World J Gastroenterol. Jan 14, 2017; 23(2): 286-296
Published online Jan 14, 2017. doi: 10.3748/wjg.v23.i2.286
Published online Jan 14, 2017. doi: 10.3748/wjg.v23.i2.286
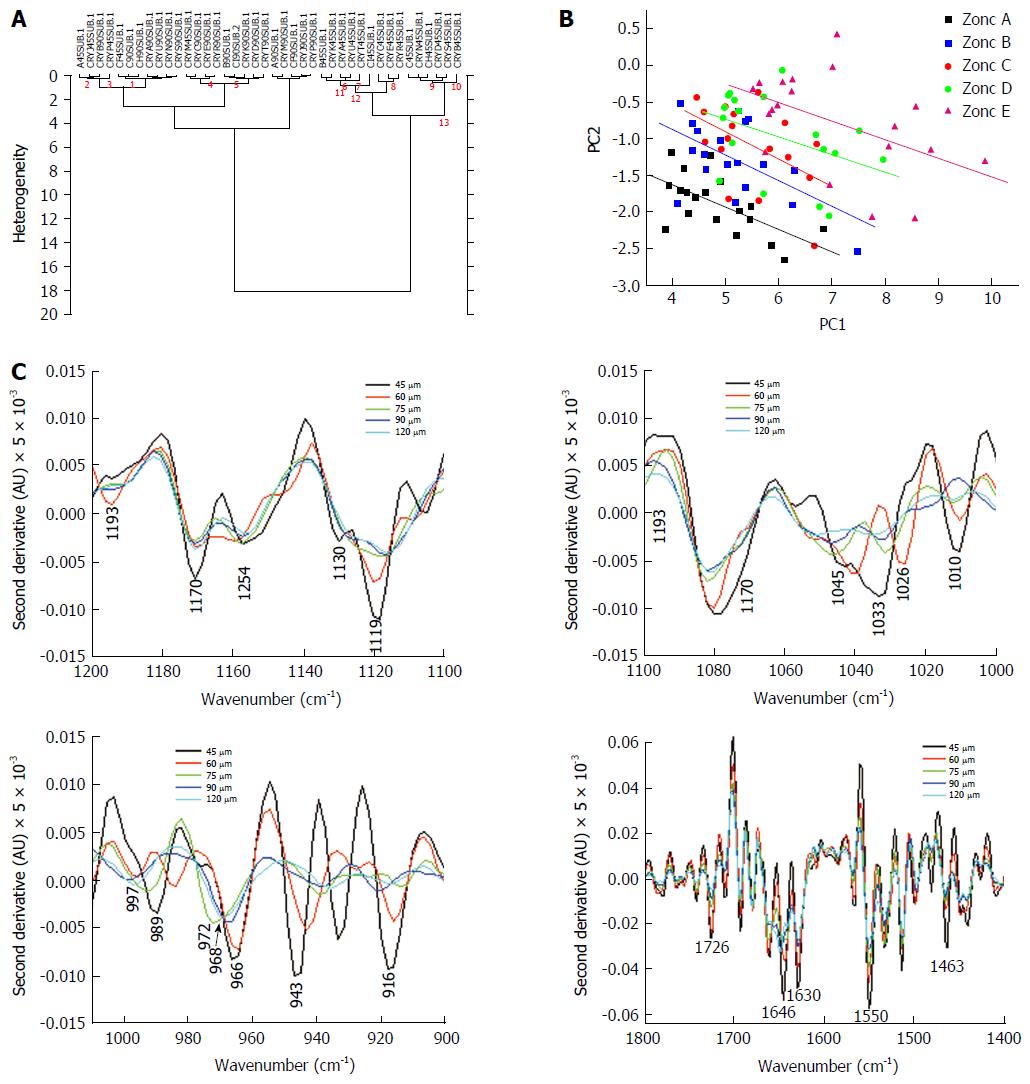
Figure 3 Variation of the spectra due to aperture.
A: Cluster analysis of spectra obtained with apertures of 45 and 90 μm to show the variation if composition between zones and similarity within zones. Forty-five and ninety numbers indicate the apertures in the labels of crypts; B: PCA analysis of the spectra showing the variation in biochemistry along the crypt diameter. The lines are drawn to show the group and are not mathematical in origin; C: Second derivative of the normalized spectra obtained with various apertures, in the region between 900-1200 cm-1 showing the different wave numbers where the carbohydrates and nucleic acids absorb and how these vary due to the aperture.
- Citation: Sahu RK, Salman A, Mordechai S. Tracing overlapping biological signals in mid-infrared using colonic tissues as a model system. World J Gastroenterol 2017; 23(2): 286-296
- URL: https://www.wjgnet.com/1007-9327/full/v23/i2/286.htm
- DOI: https://dx.doi.org/10.3748/wjg.v23.i2.286


