Copyright
©The Author(s) 2017.
World J Gastroenterol. Jan 14, 2017; 23(2): 216-223
Published online Jan 14, 2017. doi: 10.3748/wjg.v23.i2.216
Published online Jan 14, 2017. doi: 10.3748/wjg.v23.i2.216
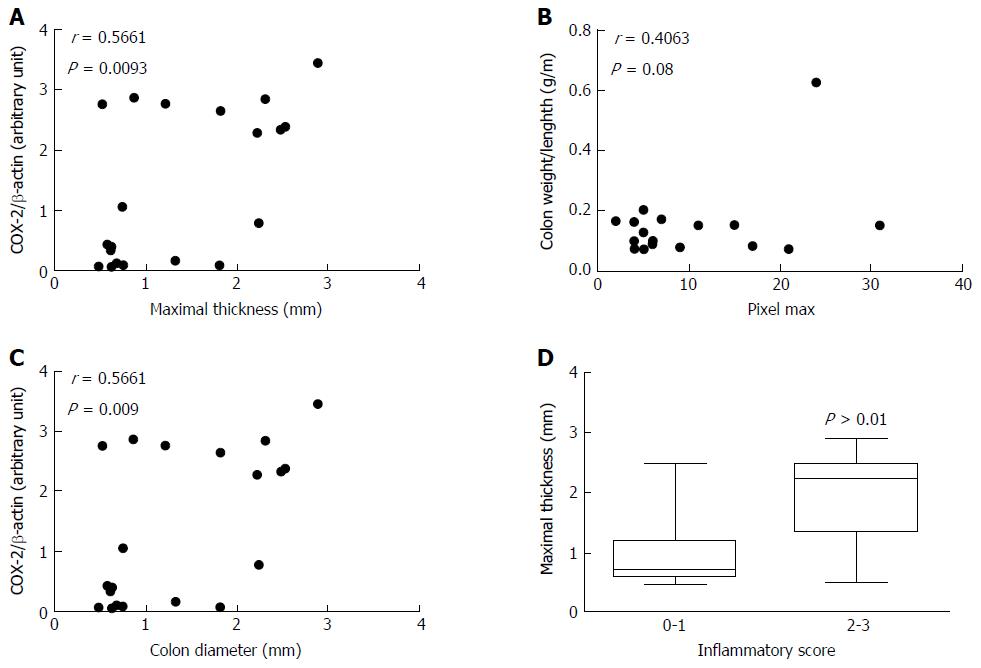
Figure 4 Association between SPECT-computed tomography parameters with inflammatory markers in rats with 2,4,6-trinitrobenzene sulfonic acid-induced colitis.
Colitis was induced in rats by intrarectal injection of TNBS at day 0. SPECT- computed tomography was performed at day 2. A: Simple linear regression between maximal thickness and colon cycloxygenase-2 expression; B: Simple linear regression between pixel max and colon weight:length ratio; C: Simple linear regression between colon diameter and colon cycloxygenase-2 expression; D: Maximal thickness according to histological inflammation score.
- Citation: Marion-Letellier R, Bohn P, Modzelewski R, Vera P, Aziz M, Guérin C, Savoye G, Savoye-Collet C. SPECT-computed tomography in rats with TNBS-induced colitis: A first step toward functional imaging. World J Gastroenterol 2017; 23(2): 216-223
- URL: https://www.wjgnet.com/1007-9327/full/v23/i2/216.htm
- DOI: https://dx.doi.org/10.3748/wjg.v23.i2.216


