Copyright
©The Author(s) 2017.
World J Gastroenterol. Jan 14, 2017; 23(2): 216-223
Published online Jan 14, 2017. doi: 10.3748/wjg.v23.i2.216
Published online Jan 14, 2017. doi: 10.3748/wjg.v23.i2.216
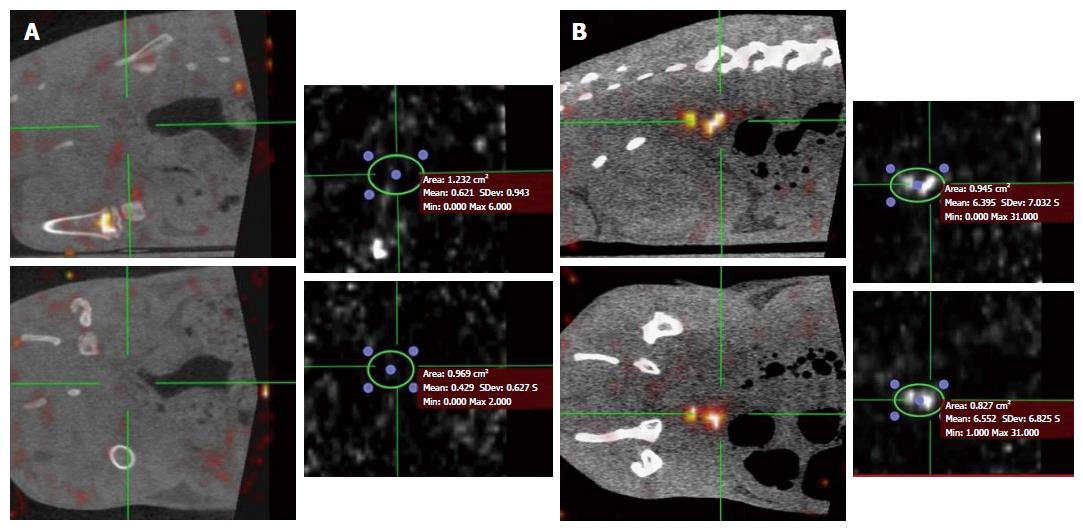
Figure 1 Sagittal and coronal images of SPECT-computed tomography and the corresponding value of maximal signal colon wall intensity in a control (A) or 2,4,6-trinitrobenzene sulfonic acid (B) rat.
- Citation: Marion-Letellier R, Bohn P, Modzelewski R, Vera P, Aziz M, Guérin C, Savoye G, Savoye-Collet C. SPECT-computed tomography in rats with TNBS-induced colitis: A first step toward functional imaging. World J Gastroenterol 2017; 23(2): 216-223
- URL: https://www.wjgnet.com/1007-9327/full/v23/i2/216.htm
- DOI: https://dx.doi.org/10.3748/wjg.v23.i2.216


