Copyright
©The Author(s) 2017.
World J Gastroenterol. May 21, 2017; 23(19): 3449-3467
Published online May 21, 2017. doi: 10.3748/wjg.v23.i19.3449
Published online May 21, 2017. doi: 10.3748/wjg.v23.i19.3449
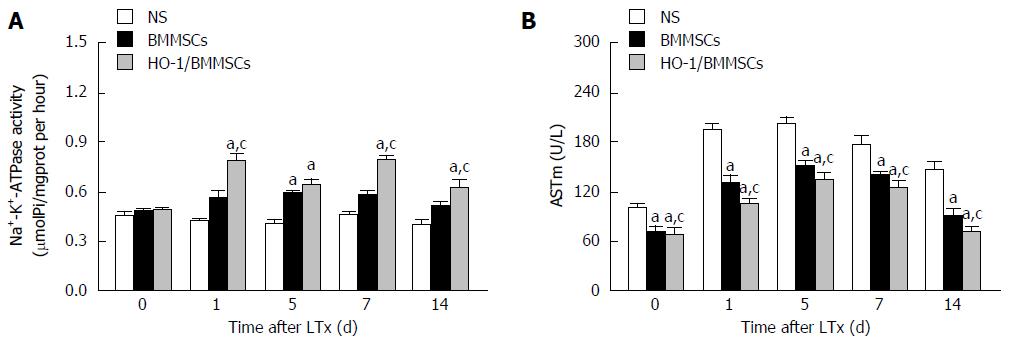
Figure 12 Liver Na+-K+-ATPase activity and mitochondrial aspartate aminotransferase level after liver transplantation.
A: Na+-K+-ATPase activity; B: Serum mitochondrial aspartate aminotransferase (ASTm). Na+-K+-ATPase activity (μmoLPi/mgprot per hour): The degradation of ATP per mg of protein per hour produces 1 μmol of inorganic phosphorus was defined as one unit of ATPase activity. The activities of ATPase in the HO-1/BMMSCs group were higher than those of the BMMSCs and NS groups. Postoperative day (POD) 1: HO-1/BMMSCs group vs NS group: 0.79 ± 0.04 vs 0.42 ± 0.02 (P < 0.01); HO-1/BMMSCs group vs BMMSCs group: 0.79 ± 0.04 vs 0.57 ± 0.04 (P < 0.01). POD5: BMMSCs vs NS group: 0.59 ± 0.01 vs 0.40 ± 0.03 (P < 0.05); HO-1/BMMSCs vs NS group: 0.64 ± 0.04 vs 0.40 ± 0.03 (P < 0.01). POD7: HO-1/BMMSCs group vs NS group: 0.79 ± 0.03 vs 0.46 ± 0.02 (P < 0.01); HO-1/BMMSCs group vs BMMSCs group: 0.79 ± 0.03 vs 0.58 ± 0.03 (P < 0.01). POD14: HO-1/BMMSCs group vs NS group: 0.63 ± 0.05 vs 0.40 ± 0.03 (P < 0.01); HO-1/BMMSCs group vs BMMSCs group: 0.63 ± 0.05 vs 0.52 ± 0.03 (P < 0.05). ASTm showed a tendency to increase initially and then decrease with the extension of post-operative time. The expression of ASTm was the lowest in the HO-1/BMMSCs group and highest in the NS group on POD0, 1, 5, 7 and 14 (P < 0.05). aP < 0.05 vs NS group, cP < 0.05 vs HO-1/BMMSCs group.
- Citation: Yang L, Shen ZY, Wang RR, Yin ML, Zheng WP, Wu B, Liu T, Song HL. Effects of heme oxygenase-1-modified bone marrow mesenchymal stem cells on microcirculation and energy metabolism following liver transplantation. World J Gastroenterol 2017; 23(19): 3449-3467
- URL: https://www.wjgnet.com/1007-9327/full/v23/i19/3449.htm
- DOI: https://dx.doi.org/10.3748/wjg.v23.i19.3449


