Copyright
©The Author(s) 2017.
World J Gastroenterol. May 21, 2017; 23(19): 3449-3467
Published online May 21, 2017. doi: 10.3748/wjg.v23.i19.3449
Published online May 21, 2017. doi: 10.3748/wjg.v23.i19.3449
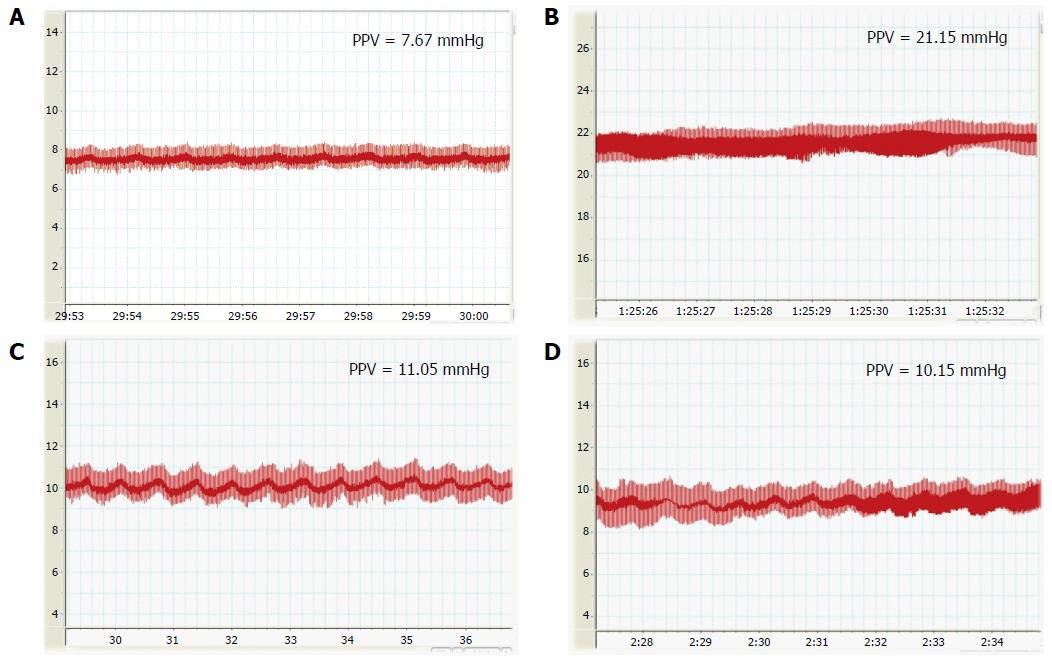
Figure 4 Portal vein pressure on the 7th d after liver transplantation.
A: Portal vein pressure (PVP) of normal BN rats; B: PVP of normal saline (NS) group on postoperative day (POD) 7; C: PVP of bone marrow-derived mesenchymal stem cells (BMMSCs) group on POD7; D: PVP of HO-1/BMMSCs group on POD7. PVP of both the HO-1/BMMSCs group and the BMMSCs group was significantly lower than that of NS group on POD7 (P < 0.05). HO-1/BMMSCs group vs NS group: 10.67 ± 0.35 vs 21.26 ± 0.20 (P < 0.01); BMMSCs group vs NS group: 10.95 ± 0.22 vs 21.26 ± 0.20 (P < 0.01).
- Citation: Yang L, Shen ZY, Wang RR, Yin ML, Zheng WP, Wu B, Liu T, Song HL. Effects of heme oxygenase-1-modified bone marrow mesenchymal stem cells on microcirculation and energy metabolism following liver transplantation. World J Gastroenterol 2017; 23(19): 3449-3467
- URL: https://www.wjgnet.com/1007-9327/full/v23/i19/3449.htm
- DOI: https://dx.doi.org/10.3748/wjg.v23.i19.3449


