Copyright
©The Author(s) 2017.
World J Gastroenterol. May 21, 2017; 23(19): 3449-3467
Published online May 21, 2017. doi: 10.3748/wjg.v23.i19.3449
Published online May 21, 2017. doi: 10.3748/wjg.v23.i19.3449
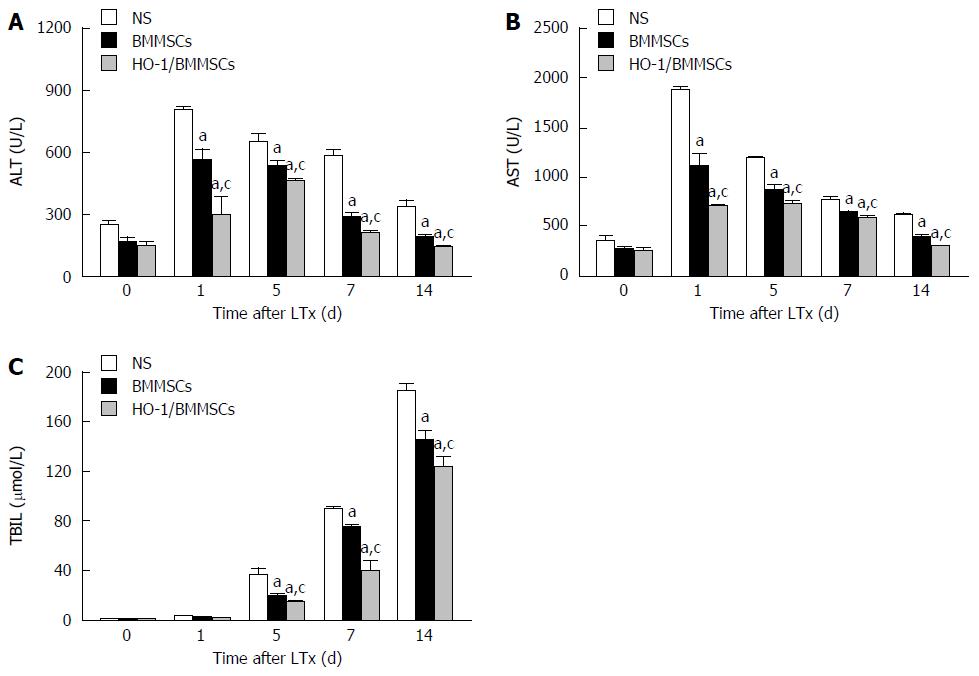
Figure 3 The level of liver function indexes after liver transplantation.
A: Alanine aminotransferase (ALT); B: Aspartate aminotransferase (AST); C: Total bilirubin (TBIL). The serum ALT and AST in the three groups increased initially and then decreased with increasing post-operative time. The serum liver enzymes in the HO-1/BMMSCs group were the lowest, and NS group were the highest on postoperative day (POD) 1, 5, 7, and 14 (P < 0.05). TBIL showed a trend to increase with time. TBIL of the HO-1/BMMSCs group were the lowest, and were highest in the NS group on POD5, 7 and 14 (P < 0.05). aP < 0.05 vs NS group, cP < 0.05 vs HO-1/BMMSCs group.
- Citation: Yang L, Shen ZY, Wang RR, Yin ML, Zheng WP, Wu B, Liu T, Song HL. Effects of heme oxygenase-1-modified bone marrow mesenchymal stem cells on microcirculation and energy metabolism following liver transplantation. World J Gastroenterol 2017; 23(19): 3449-3467
- URL: https://www.wjgnet.com/1007-9327/full/v23/i19/3449.htm
- DOI: https://dx.doi.org/10.3748/wjg.v23.i19.3449


