Copyright
©The Author(s) 2017.
World J Gastroenterol. May 21, 2017; 23(19): 3449-3467
Published online May 21, 2017. doi: 10.3748/wjg.v23.i19.3449
Published online May 21, 2017. doi: 10.3748/wjg.v23.i19.3449
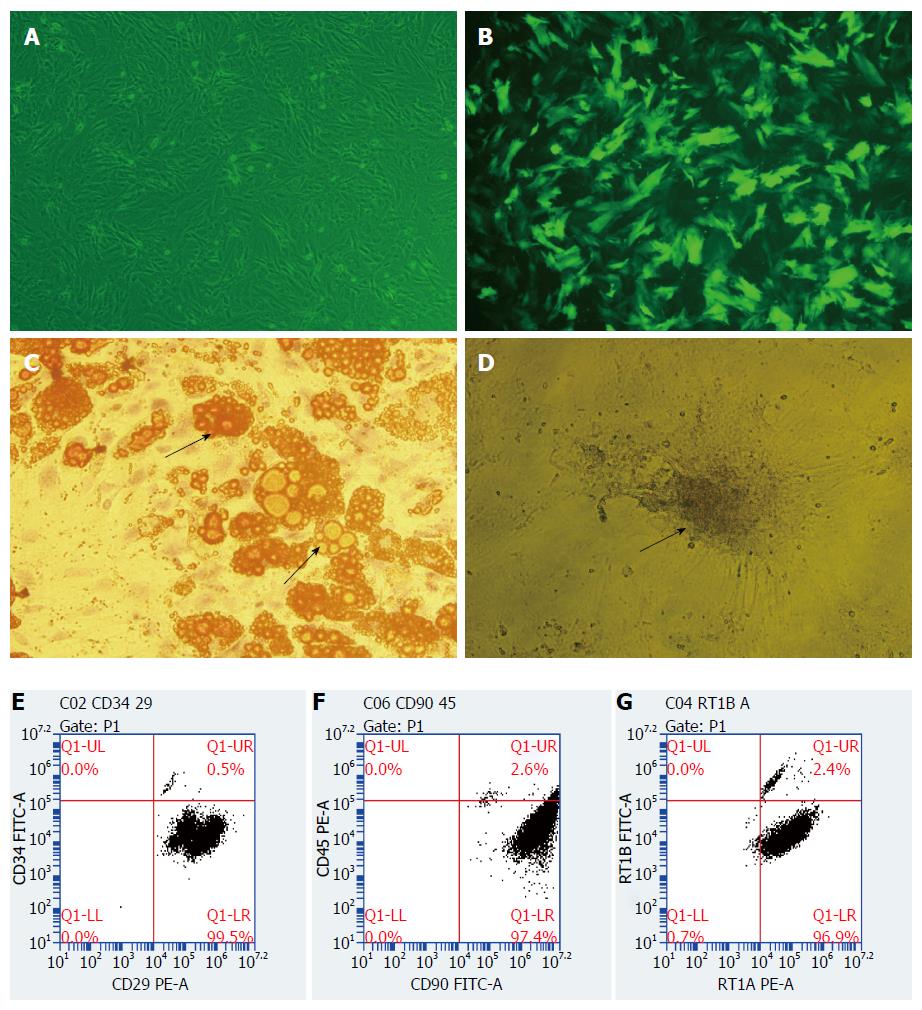
Figure 1 Morphology, transformation, and flow cytometric analysis of bone marrow-derived mesenchymal stem cells.
A: The third generation of bone marrow-derived mesenchymal stem cells (BMMSCs) (normal field, × 100): BMMSCs grew to complete adherence, and the cells were spindle-shaped, some were in a vortex or daisy-likearrangement; B: HO-1/BMMSCs (fluorescence field, × 100): more than 80% of the BMMSCs expressed green fluorescence after transduction with HO-1; C: Adipogenic induction of BMMSCs, with orange lipid droplets stained by Oil red O in cytoplasm (× 200, shown by an arrow); D: Osteogenic induction of BMMSCs, with black calcium deposits in cytoplasm stained by von Kossa’s reagent (× 200, shown by an arrow); E: The percentage of CD29+CD34- cells was 99.5%; F: The percentage of CD90+CD45- cells was 97.4%; G: The percentage of RT1A+RT1B- cells was 96.9%.
- Citation: Yang L, Shen ZY, Wang RR, Yin ML, Zheng WP, Wu B, Liu T, Song HL. Effects of heme oxygenase-1-modified bone marrow mesenchymal stem cells on microcirculation and energy metabolism following liver transplantation. World J Gastroenterol 2017; 23(19): 3449-3467
- URL: https://www.wjgnet.com/1007-9327/full/v23/i19/3449.htm
- DOI: https://dx.doi.org/10.3748/wjg.v23.i19.3449


