Copyright
©The Author(s) 2017.
World J Gastroenterol. May 21, 2017; 23(19): 3427-3439
Published online May 21, 2017. doi: 10.3748/wjg.v23.i19.3427
Published online May 21, 2017. doi: 10.3748/wjg.v23.i19.3427
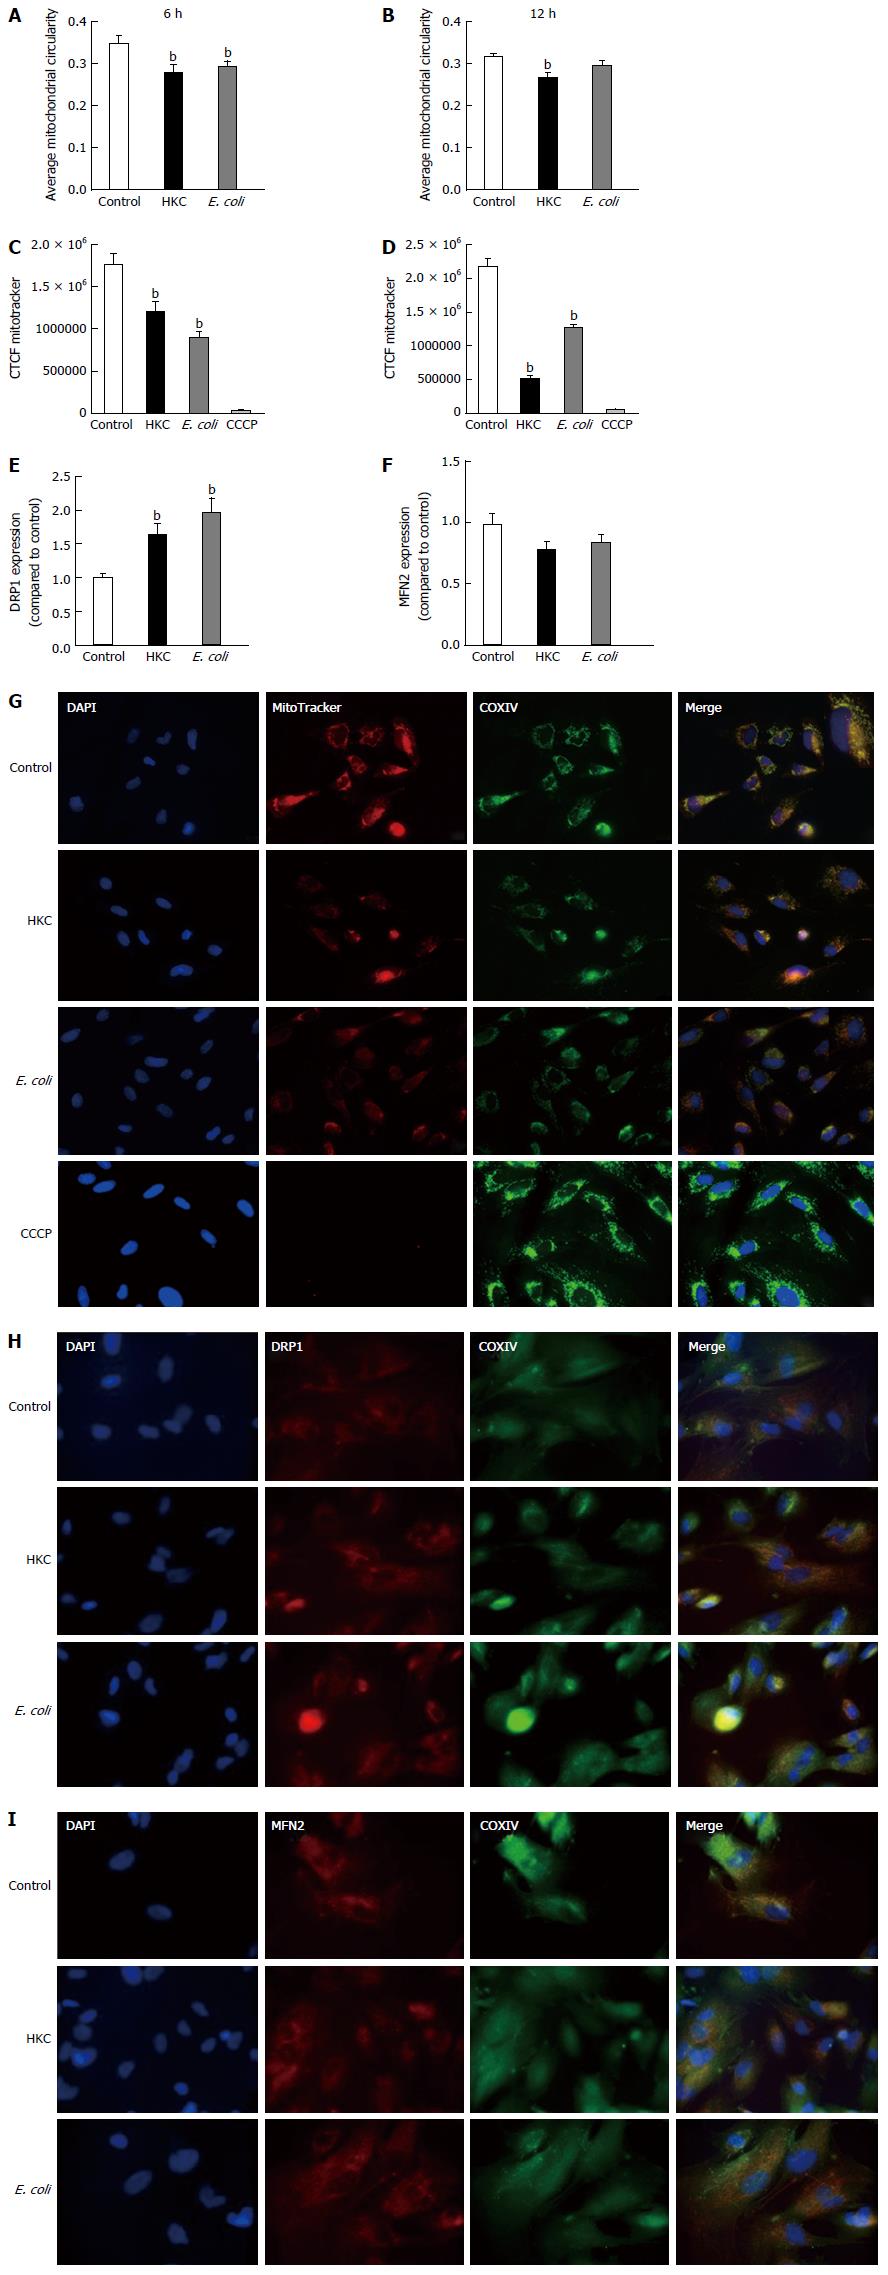
Figure 3 Mitochondrial dysfunction in CRL.
1790 cells is evident during microbial stimulation. CRL.1790 cells stimulated with heat killed cecal contents (HKC) or heat killed E. coli for 6 h and 12 h were assessed for mitochondrial function using mitotracker staining. A and B: Denotes average circularity of mitochondria assessed 6 h and 12 h post stimulation respectively; C and D: Denotes intensity of mitotacker staining in cells 6 h and 12 h post stimulation respectively; E and F: Expression of DRP1 and MFN2 in CRL.1790 cells treated with HKC or E.coli for 6 h and 12 h post stimulation respectively; G: Representative images showing mitotracker staining (n = 3) (magnification × 60); H and I: Representative images showing expression of Drp1 and MFN2 (magnification × 60). bP < 0.01 vs Control. Data are expressed as mean ± SE. CTCF: Corrected total cell fluorescence; CCCP: Carbonyl cyanide 3-cholorphenylhydrazone.
- Citation: Packiriswamy N, Coulson KF, Holcombe SJ, Sordillo LM. Oxidative stress-induced mitochondrial dysfunction in a normal colon epithelial cell line. World J Gastroenterol 2017; 23(19): 3427-3439
- URL: https://www.wjgnet.com/1007-9327/full/v23/i19/3427.htm
- DOI: https://dx.doi.org/10.3748/wjg.v23.i19.3427


