Copyright
©The Author(s) 2017.
World J Gastroenterol. May 7, 2017; 23(17): 3133-3141
Published online May 7, 2017. doi: 10.3748/wjg.v23.i17.3133
Published online May 7, 2017. doi: 10.3748/wjg.v23.i17.3133
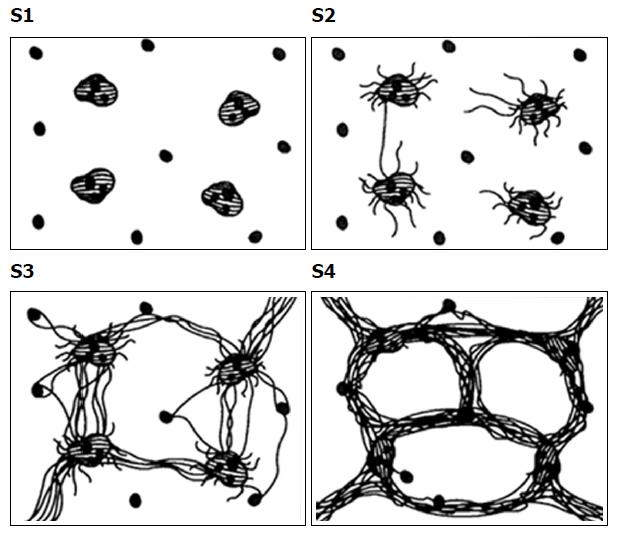
Figure 2 Schematic diagram of staging of hepatic fibrosis.
S1: Portal fibrosis characterized by mild fibrous expansion of portal tracts; S2: Periportal fibrosis showing fine strands of connective tissue in zone 1 with only rare portal-portal septa; S3: Septal fibrosis manifested by connective tissue bridges that link portal tracts with other portal tracts and central veins; minimally distorted architecture, but no regenerative nodules; S4: Cirrhosis showing bridging fibrosis and nodular regeneration.
- Citation: Li XM, Chen Z, Xiao EH, Shang QL, Ma C. Diagnostic value of gadobenate dimeglumine-enhanced hepatocyte-phase magnetic resonance imaging in evaluating hepatic fibrosis and hepatitis. World J Gastroenterol 2017; 23(17): 3133-3141
- URL: https://www.wjgnet.com/1007-9327/full/v23/i17/3133.htm
- DOI: https://dx.doi.org/10.3748/wjg.v23.i17.3133


