Copyright
©The Author(s) 2017.
World J Gastroenterol. Apr 28, 2017; 23(16): 2957-2963
Published online Apr 28, 2017. doi: 10.3748/wjg.v23.i16.2957
Published online Apr 28, 2017. doi: 10.3748/wjg.v23.i16.2957
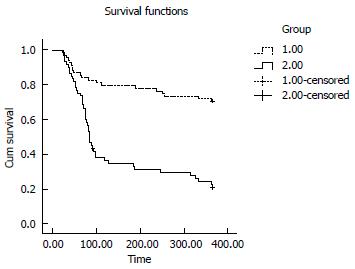
Figure 3 Kaplan-Meier curves demonstrating the 365-d survival rates.
1: Observation group; 2: Control group. Observation group vs control group [48/68 (70.6%) vs 13/60 (21.7%), P = 00000].
- Citation: Mou HY, Nie HM, Hu XY. Gutuo Jiejiu decoction improves survival of patients with severe alcoholic hepatitis: A retrospective cohort study. World J Gastroenterol 2017; 23(16): 2957-2963
- URL: https://www.wjgnet.com/1007-9327/full/v23/i16/2957.htm
- DOI: https://dx.doi.org/10.3748/wjg.v23.i16.2957


