Copyright
©The Author(s) 2017.
World J Gastroenterol. Apr 28, 2017; 23(16): 2891-2898
Published online Apr 28, 2017. doi: 10.3748/wjg.v23.i16.2891
Published online Apr 28, 2017. doi: 10.3748/wjg.v23.i16.2891
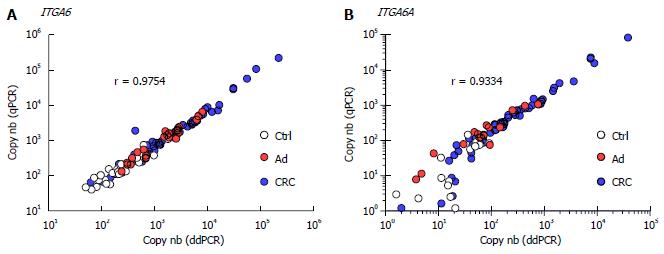
Figure 3 Correlation between ddPCR and qPCR measurements.
ITGA6 (A) and ITGA6A (B) levels (copy number) detected in controls (Ctrl: white), Ad (red) and CRC (blue) were plotted and evaluated using the nonparametric Spearman correlation test.
- Citation: Herring E, Kanaoka S, Tremblay É, Beaulieu JF. Droplet digital PCR for quantification of ITGA6 in a stool mRNA assay for the detection of colorectal cancers. World J Gastroenterol 2017; 23(16): 2891-2898
- URL: https://www.wjgnet.com/1007-9327/full/v23/i16/2891.htm
- DOI: https://dx.doi.org/10.3748/wjg.v23.i16.2891


