Copyright
©The Author(s) 2017.
World J Gastroenterol. Apr 21, 2017; 23(15): 2685-2695
Published online Apr 21, 2017. doi: 10.3748/wjg.v23.i15.2685
Published online Apr 21, 2017. doi: 10.3748/wjg.v23.i15.2685
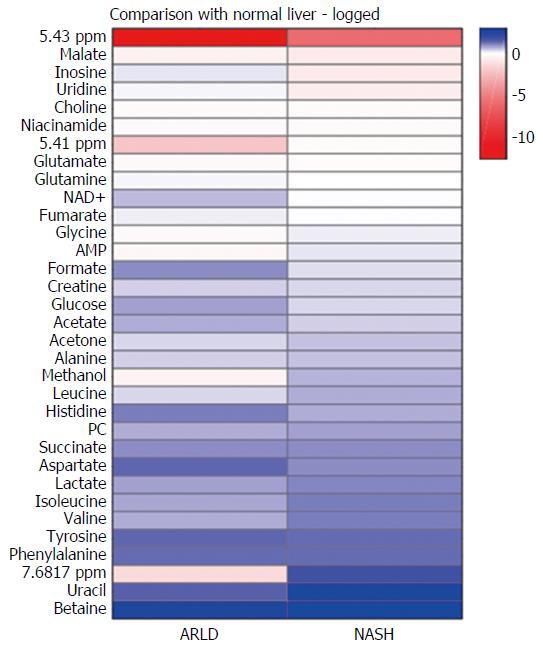
Figure 4 Heat map comparing the alcohol-related liver damage and nonalcoholic steatohepatitis spectra with the donor spectra.
The squares are coloured according to: log2 (mean fractional intensity of metabolite X in class Y/ mean fractional intensity of metabolite X in donor class) with blue indicating that metabolite X is higher in the class Y and red indicating that metabolite X is lower in the class Y. NASH: Nonalcoholic steatohepatitis; ARLD: Alcohol-related liver damage.
- Citation: Schofield Z, Reed MA, Newsome PN, Adams DH, Günther UL, Lalor PF. Changes in human hepatic metabolism in steatosis and cirrhosis. World J Gastroenterol 2017; 23(15): 2685-2695
- URL: https://www.wjgnet.com/1007-9327/full/v23/i15/2685.htm
- DOI: https://dx.doi.org/10.3748/wjg.v23.i15.2685


