Copyright
©The Author(s) 2017.
World J Gastroenterol. Apr 21, 2017; 23(15): 2673-2684
Published online Apr 21, 2017. doi: 10.3748/wjg.v23.i15.2673
Published online Apr 21, 2017. doi: 10.3748/wjg.v23.i15.2673
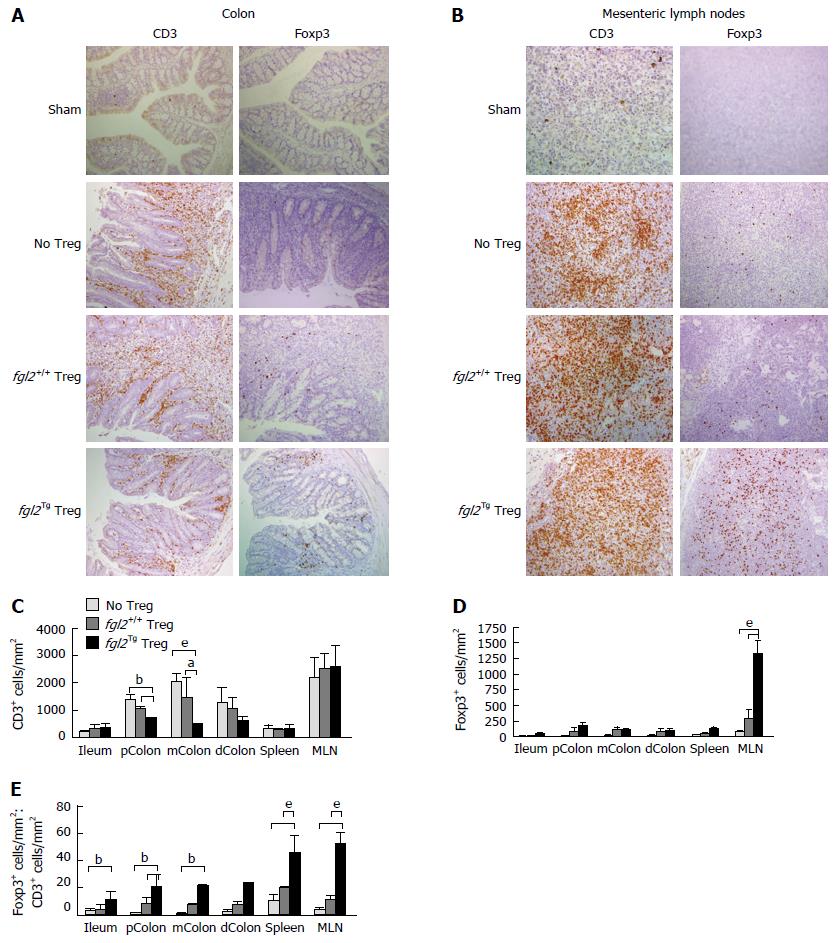
Figure 4 Foxp3+ Treg are increased and CD3+ T cells are decreased in mice that received fgl2Tg Treg.
A: Representative photomicrographs of CD3 and Foxp3 staining of colonic sections. Sham colons were negative for both CD3 and Foxp3. Mice that received Teff and no Treg or fgl2+/+ Treg had large numbers of CD3+ T cells in the lamina propria and epithelium, whereas colons from mice that received fgl2Tg Treg had only patchy CD3+ T cell infiltrates. Original magnification × 100; B: Representative photomicrographs of CD3 and Foxp3 staining of MLN sections. MLN from sham mice had very few CD3+ cells. In contrast, large numbers of CD3+ T cells were seen in the MLN of the other groups of mice. Treg staining was absent in the MLN of sham mice and very few Foxp3+ cells were seen in mice that only received Teff or mice that received fgl2+/+ Treg, whereas large numbers of Foxp3+ cells were seen in mice that received fgl2Tg Treg. Original magnification × 100; C: Absolute numbers of CD3+ cells by morphometry (cells/mm2); D: Absolute numbers of Foxp3+ T cells by morphometry (cells/mm2); E: Ratio of Foxp3+ to CD3+ T cells in each tissue section. Data represent the mean ± SD. Quantification is based on two independent experiments with n ≥ 5 mice per group (aP < 0.05, bP < 0.01, eP < 0.001). MLN: Mesenteric lymph nodes; Teff: Effector T cells; Treg: Regulatory T cells.
- Citation: Bartczak A, Zhang J, Adeyi O, Amir A, Grant D, Gorczynski R, Selzner N, Chruscinski A, Levy GA. Overexpression of fibrinogen-like protein 2 protects against T cell-induced colitis. World J Gastroenterol 2017; 23(15): 2673-2684
- URL: https://www.wjgnet.com/1007-9327/full/v23/i15/2673.htm
- DOI: https://dx.doi.org/10.3748/wjg.v23.i15.2673


