Copyright
©The Author(s) 2017.
World J Gastroenterol. Apr 21, 2017; 23(15): 2673-2684
Published online Apr 21, 2017. doi: 10.3748/wjg.v23.i15.2673
Published online Apr 21, 2017. doi: 10.3748/wjg.v23.i15.2673
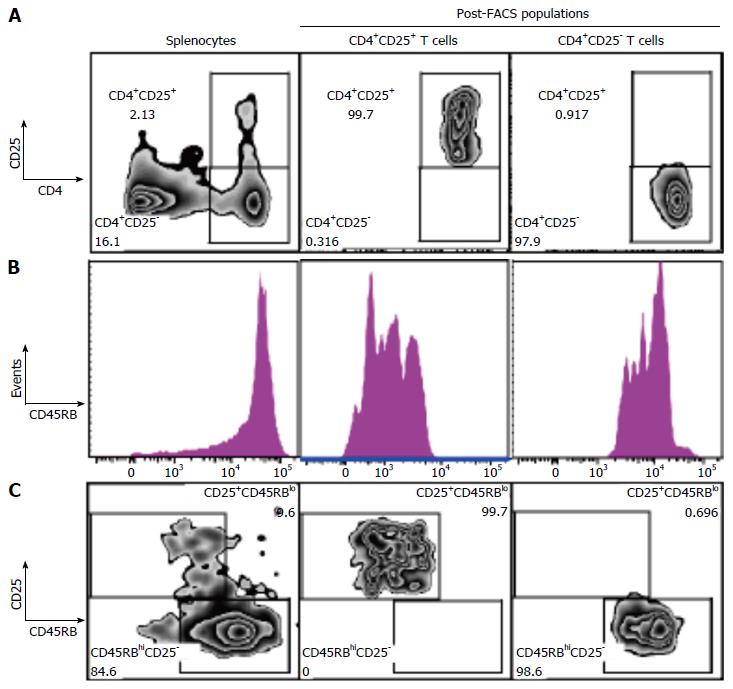
Figure 2 Isolation of CD4+CD25+CD45RBlow Treg and CD4+CD25-CD45RBhigh Teff.
A: Representative flow plots of CD4 vs CD25 populations. SMNC were isolated and enriched for CD4+ T cells by negative T cell selection using magnetic cell sorting. CD4+ T cells fractions were stained with CD4+-PE-Cy7, CD25+-PE and CD45RB-APC and sorted into CD4+CD25+CD45RBlow and CD4+CD25-CD45RBhigh T cell fractions. Cells were gated on live cells, singlets and CD4+ populations. Plots show initial SMNC population and the CD4+CD25+ and CD4+CD25- T cell populations following FACS sorting; B: Histogram of CD45RB cell distribution; C: Flow plots of CD25 vs CD45RB populations. Final populations of CD4+CD25+CD45RBlow and CD4+CD25-CD45RBhigh T cell fractions were > 98% pure. SMNC: Splenic mononuclear cells; Teff: Effector T cell; Treg: Regulatory T cell.
- Citation: Bartczak A, Zhang J, Adeyi O, Amir A, Grant D, Gorczynski R, Selzner N, Chruscinski A, Levy GA. Overexpression of fibrinogen-like protein 2 protects against T cell-induced colitis. World J Gastroenterol 2017; 23(15): 2673-2684
- URL: https://www.wjgnet.com/1007-9327/full/v23/i15/2673.htm
- DOI: https://dx.doi.org/10.3748/wjg.v23.i15.2673


