Copyright
©The Author(s) 2017.
World J Gastroenterol. Apr 21, 2017; 23(15): 2673-2684
Published online Apr 21, 2017. doi: 10.3748/wjg.v23.i15.2673
Published online Apr 21, 2017. doi: 10.3748/wjg.v23.i15.2673
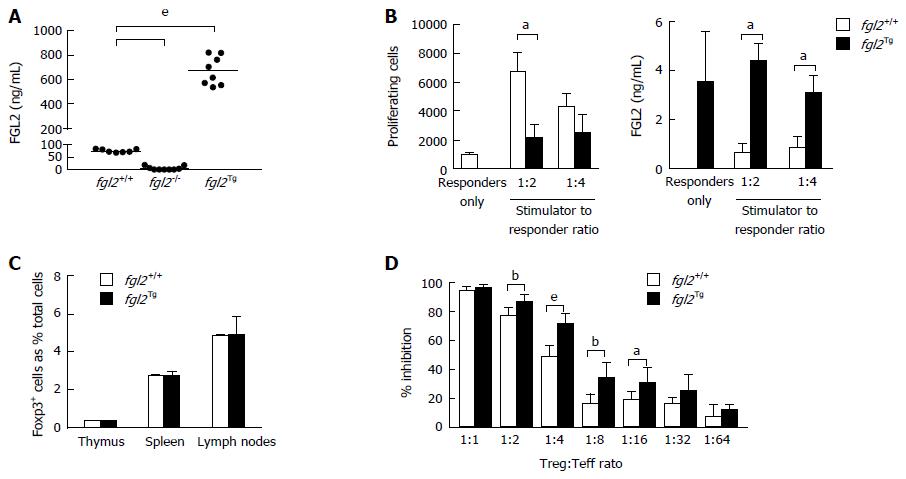
Figure 1 Immunologic characterization of fgl2Tg mice.
A: Fibrinogen-like protein 2 (FGL2) plasma levels. Bar represents mean levels (n = 7-8 mice/group); B: One-way MLR and FGL2 levels in MLR culture supernatants. FGL2 overexpression inhibits T cell proliferation in response to stimulation with BALB/c alloantigens. Proliferation was measured by flow cytometry. FGL2 levels in MLR culture supernatant were measured by an FGL2 ELISA. Data represent the mean ± SD and are representative of three independent experiments; C: Foxp3+ cell percentages in the thymus, spleen and lymph nodes. Foxp3+ cells are represented as a percentage of total SMNC. Data are expressed as the mean ± SD (n = 3 mice/group); D: Treg suppression assay. The suppressive activity of Treg is expressed as a percent inhibition of T cell proliferation compared to responder T cells alone. Graphs show the mean ± SD. Data are representative of 3 independent experiments. (aP < 0.05, bP < 0.01, eP < 0.001). MLR: Mixed lymphocyte reaction; SMNC: Splenic mononuclear cells; Treg: Regulatory T cell.
- Citation: Bartczak A, Zhang J, Adeyi O, Amir A, Grant D, Gorczynski R, Selzner N, Chruscinski A, Levy GA. Overexpression of fibrinogen-like protein 2 protects against T cell-induced colitis. World J Gastroenterol 2017; 23(15): 2673-2684
- URL: https://www.wjgnet.com/1007-9327/full/v23/i15/2673.htm
- DOI: https://dx.doi.org/10.3748/wjg.v23.i15.2673


