Copyright
©The Author(s) 2017.
World J Gastroenterol. Apr 7, 2017; 23(13): 2355-2364
Published online Apr 7, 2017. doi: 10.3748/wjg.v23.i13.2355
Published online Apr 7, 2017. doi: 10.3748/wjg.v23.i13.2355
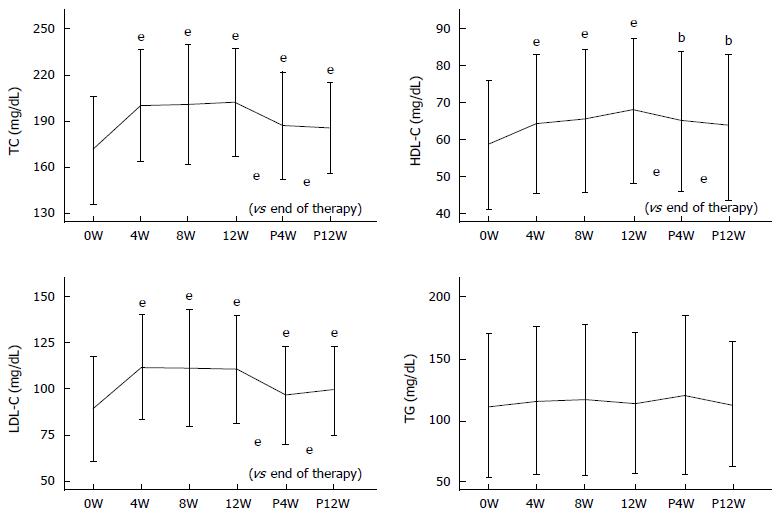
Figure 2 Longitudinal changes in serum total cholesterol, low-density lipoprotein cholesterol, high-density lipoprotein cholesterol, and triglyceride during and after the treatment in SOF + LDV-SVR group.
Mean value of serum TC, LDL-C, HDL-C, TG at baseline (0W), 4 wk (4W), 8 wk (8W), 12 wk (12W) of SOF + LDV treatment and 4 wk (P4W), and 12 wk (12W) after the end of SOF + LDV treatment was plotted. Vertical line expressed the range of mean ± SD. Statistical significance from baseline was indicated at upper part of each graph. Statistical significance at P4W and P12W compared to the end of therapy was indicated at the lower part of each graph (bP < 0.01, eP < 0.001). SOF: Sofosbuvir; LDV: Ledipasvir; TC: Total cholesterol; LDL-C: Low-density lipoprotein cholesterol; HDL-C: High-density lipoprotein cholesterol; TG: Triglyceride.
- Citation: Endo D, Satoh K, Shimada N, Hokari A, Aizawa Y. Impact of interferon-free antivirus therapy on lipid profiles in patients with chronic hepatitis C genotype 1b. World J Gastroenterol 2017; 23(13): 2355-2364
- URL: https://www.wjgnet.com/1007-9327/full/v23/i13/2355.htm
- DOI: https://dx.doi.org/10.3748/wjg.v23.i13.2355


