Copyright
©The Author(s) 2017.
World J Gastroenterol. Mar 28, 2017; 23(12): 2141-2148
Published online Mar 28, 2017. doi: 10.3748/wjg.v23.i12.2141
Published online Mar 28, 2017. doi: 10.3748/wjg.v23.i12.2141
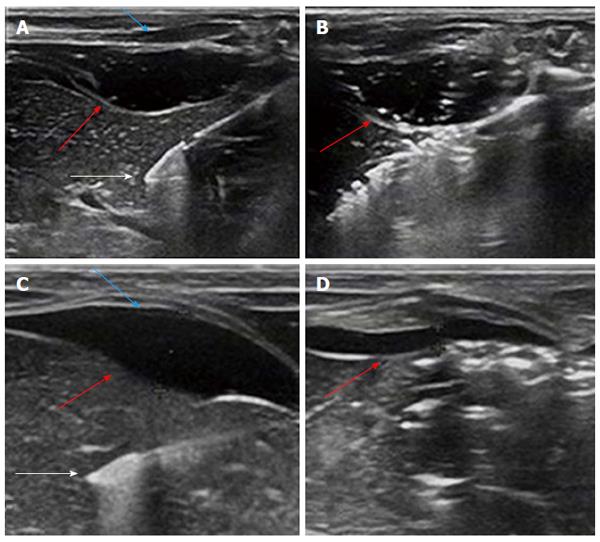
Figure 4 Ultrasonographic view.
A: Ultrasonographic view of the placement of the ablation needle (white arrow) with the poloxamer 407 (P407) gel (red arrow) positioned between the diaphragm (blue arrow) and liver; B: Image captured to assess the change in the size of P407 barrier at 3 min during microwave ablation. No apparent thinning was observed (red arrow); C: Ultrasound image showing a saline barrier (red arrow) of 5 mm thickness between the diaphragm (blue arrow) and liver and the placement of ablation needle (white arrow); D: Ultrasound image showing a hydrodissection barrier of about 1.3 mm thickness (red arrow) at the end of the ablation procedure.
- Citation: Zhang LL, Xia GM, Liu YJ, Dou R, Eisenbrey J, Liu JB, Wang XW, Qian LX. Effect of a poloxamer 407-based thermosensitive gel on minimization of thermal injury to diaphragm during microwave ablation of the liver. World J Gastroenterol 2017; 23(12): 2141-2148
- URL: https://www.wjgnet.com/1007-9327/full/v23/i12/2141.htm
- DOI: https://dx.doi.org/10.3748/wjg.v23.i12.2141


