Copyright
©The Author(s) 2017.
World J Gastroenterol. Mar 21, 2017; 23(11): 2012-2022
Published online Mar 21, 2017. doi: 10.3748/wjg.v23.i11.2012
Published online Mar 21, 2017. doi: 10.3748/wjg.v23.i11.2012
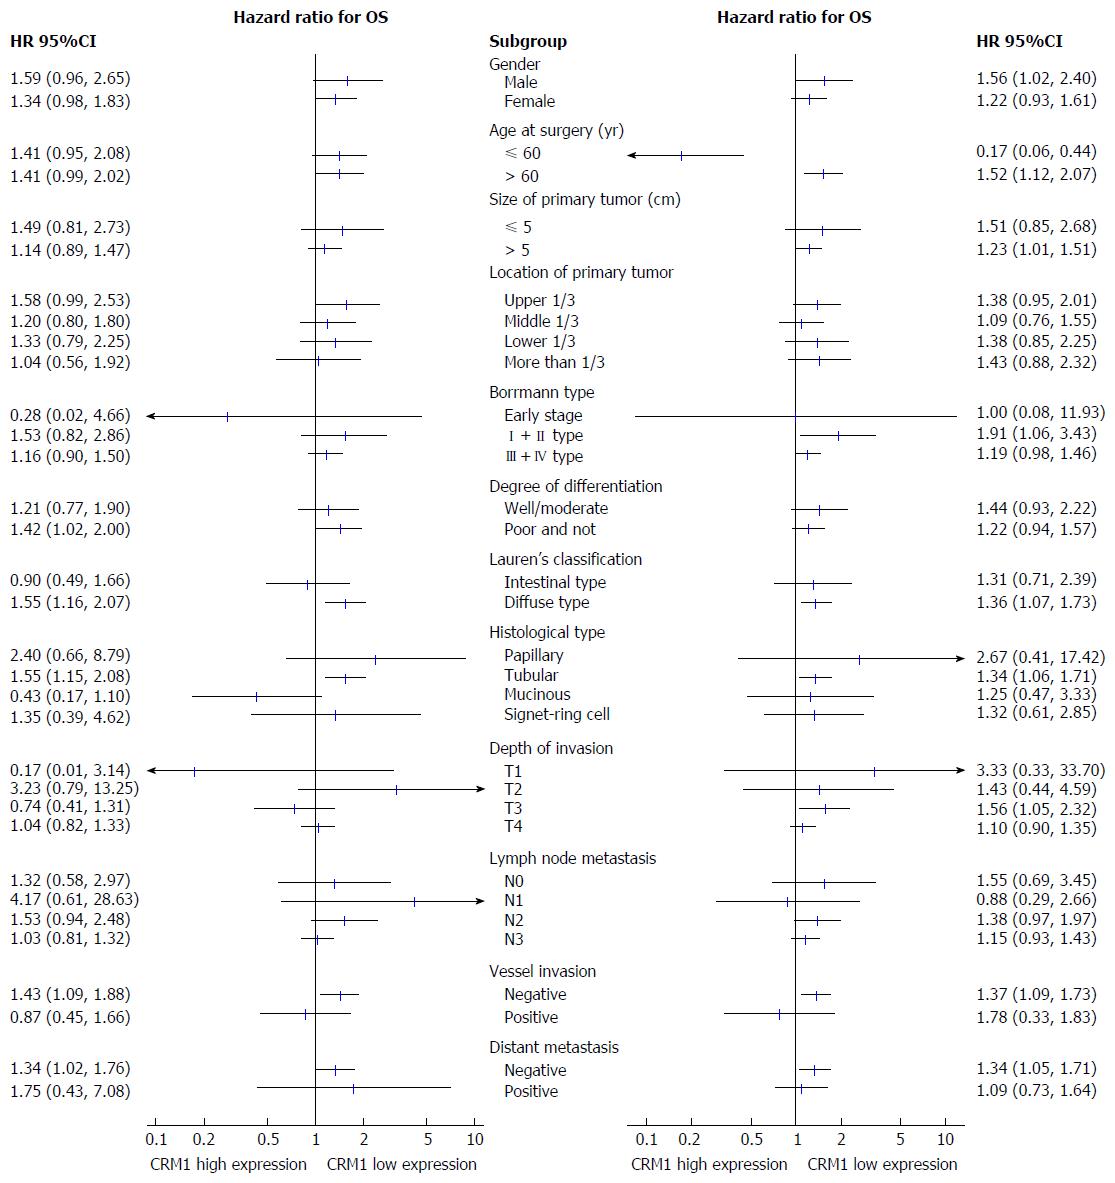
Figure 3 Forest plot showing hazard ratios (oblongs) and 95%CI (bars) for overall survival of subgroups from the 240 gastric cancer patients with different CRM1 (left) and CDK5 (right) expression status.
HR: Hazard ratio; OS: Overall survival; CRM: Chromosomal maintenance; CDK: Cyclin-dependent kinase.
- Citation: Sun YQ, Xie JW, Xie HT, Chen PC, Zhang XL, Zheng CH, Li P, Wang JB, Lin JX, Cao LL, Huang CM, Lin Y. Expression of CRM1 and CDK5 shows high prognostic accuracy for gastric cancer. World J Gastroenterol 2017; 23(11): 2012-2022
- URL: https://www.wjgnet.com/1007-9327/full/v23/i11/2012.htm
- DOI: https://dx.doi.org/10.3748/wjg.v23.i11.2012


