Copyright
©The Author(s) 2017.
World J Gastroenterol. Mar 14, 2017; 23(10): 1764-1770
Published online Mar 14, 2017. doi: 10.3748/wjg.v23.i10.1764
Published online Mar 14, 2017. doi: 10.3748/wjg.v23.i10.1764
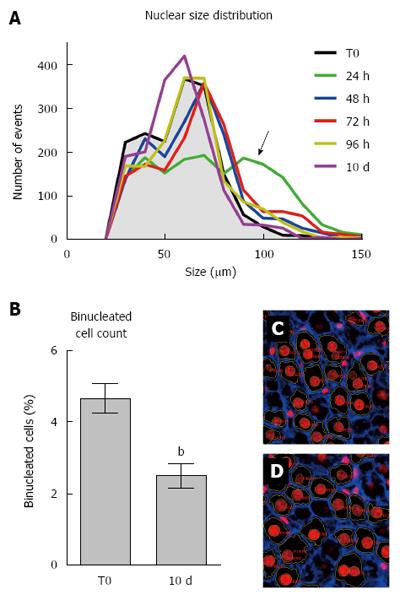
Figure 4 Size distribution of hepatocyte nuclei, the only evident change being detected after 24 h.
A: Showing nuclear size distribution over time following PH. The most prominent change is observed at 24 h post-PH (green line), with the appearance of a larger nuclear class size (arrow), which is only marginally present at later time points; B: Reporting percent of binucleated hepatocytes detected on 2D sections in control rat liver and at 10 d post-PH. A relative decrease is observed after PH; C (control rat liver) and D (10 d post-PH) show immunofluorescent staining for Phalloidin with nuclei were counterstained with DAPI. Binucleated hepatocytes are easily discerned. Data are mean ± SE of 5 animals per group. bP < 0.01, vs control group. PH: Partial surgical hepatectomy.
- Citation: Marongiu F, Marongiu M, Contini A, Serra M, Cadoni E, Murgia R, Laconi E. Hyperplasia vs hypertrophy in tissue regeneration after extensive liver resection. World J Gastroenterol 2017; 23(10): 1764-1770
- URL: https://www.wjgnet.com/1007-9327/full/v23/i10/1764.htm
- DOI: https://dx.doi.org/10.3748/wjg.v23.i10.1764


