Copyright
©The Author(s) 2017.
World J Gastroenterol. Mar 14, 2017; 23(10): 1764-1770
Published online Mar 14, 2017. doi: 10.3748/wjg.v23.i10.1764
Published online Mar 14, 2017. doi: 10.3748/wjg.v23.i10.1764
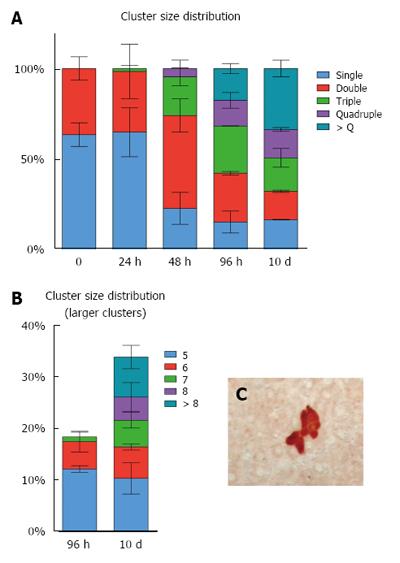
Figure 3 Size distribution of GFP+ hepatocyte clusters at various time points after partial surgical hepatectomy.
A: Each cluster was 3D reconstructed (see Methods for details) and number of hepatocytes was counted. Bars of the histogram report the frequency of each class size expressed as percent of the total number of clusters. At least one hundred clusters per group were computed; B: An expansion of panel A. It shows the class size distribution of largest clusters present at 96 h and 10 d after PH; C: An image of immunohistochemical staining for GFP. PH: Partial surgical hepatectomy; GFP+: Green fluorescent protein.
- Citation: Marongiu F, Marongiu M, Contini A, Serra M, Cadoni E, Murgia R, Laconi E. Hyperplasia vs hypertrophy in tissue regeneration after extensive liver resection. World J Gastroenterol 2017; 23(10): 1764-1770
- URL: https://www.wjgnet.com/1007-9327/full/v23/i10/1764.htm
- DOI: https://dx.doi.org/10.3748/wjg.v23.i10.1764


