Copyright
©The Author(s) 2017.
World J Gastroenterol. Mar 14, 2017; 23(10): 1764-1770
Published online Mar 14, 2017. doi: 10.3748/wjg.v23.i10.1764
Published online Mar 14, 2017. doi: 10.3748/wjg.v23.i10.1764
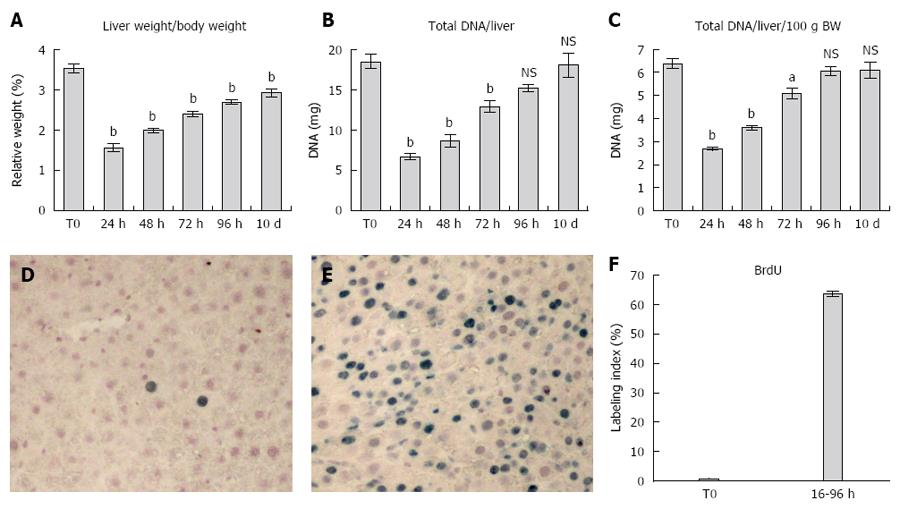
Figure 1 Kinetics of liver mass restoration following partial surgical hepatectomy.
A: Showing the gradual increase in relative liver weight, which has almost returned to control values at 10 d post-surgery, albeit a small significant difference is still present; B and C: Reporting data on liver DNA content: both total liver DNA and the relative amount (expressed as % body weight) had largely recovered at 96 h post-PH and were back to normal values by 10 d after operation; D-F: Cumulative S-phase entry of hepatocytes in response to PH. Immunohistochemical staining for BrdU is shown in panels D (control rat liver) and E (cumulative labelling from 16 to 96 h post-PH). The histogram in panel F reports percent of hepatocytes that had incorporated BrdU in their nuclei between 16 and 96 h post PH (see Methods for details). Data are mean ± SE of 5 animals per group. aP < 0.05, bP < 0.01 vs control group. PH: Partial surgical hepatectomy.
- Citation: Marongiu F, Marongiu M, Contini A, Serra M, Cadoni E, Murgia R, Laconi E. Hyperplasia vs hypertrophy in tissue regeneration after extensive liver resection. World J Gastroenterol 2017; 23(10): 1764-1770
- URL: https://www.wjgnet.com/1007-9327/full/v23/i10/1764.htm
- DOI: https://dx.doi.org/10.3748/wjg.v23.i10.1764


