Copyright
©The Author(s) 2017.
World J Gastroenterol. Jan 7, 2017; 23(1): 11-24
Published online Jan 7, 2017. doi: 10.3748/wjg.v23.i1.11
Published online Jan 7, 2017. doi: 10.3748/wjg.v23.i1.11
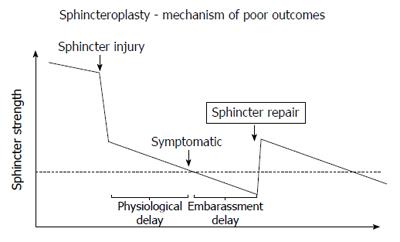
Figure 5 Model for poor outcomes after sphincteroplasty.
Hypothetical model to explain poor outcomes after sphincteroplasty: The graph shows a hypothetical time course (x-axis) of the sphincter strength (y-axis) with the dotted line representing the threshold below which incontinence becomes clinically evident. There may be a natural decline of sphincter strength (time before sphincter injury), a dramatic reduction through the injury, followed by an accelerated decline. The physiological delay represents the time until symptoms evolve, while the embarrassment delay reflects the time until a symptomatic patient acknowledges the problem. A sphincter repair may restore some strength, but with continued and possibly accelerated decline of the sphincter function the threshold is again crossed after a period of time.
- Citation: Saldana Ruiz N, Kaiser AM. Fecal incontinence - Challenges and solutions. World J Gastroenterol 2017; 23(1): 11-24
- URL: https://www.wjgnet.com/1007-9327/full/v23/i1/11.htm
- DOI: https://dx.doi.org/10.3748/wjg.v23.i1.11


