Copyright
©The Author(s) 2016.
World J Gastroenterol. Mar 7, 2016; 22(9): 2799-2810
Published online Mar 7, 2016. doi: 10.3748/wjg.v22.i9.2799
Published online Mar 7, 2016. doi: 10.3748/wjg.v22.i9.2799
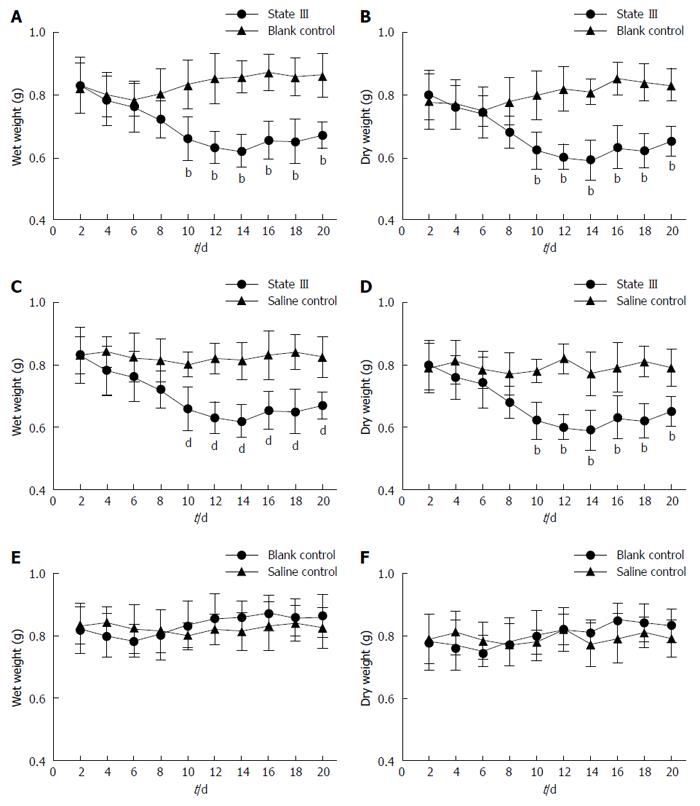
Figure 1 Changes in the wet weight and dry weight of stools in all groups.
A, B: State III mice in ice-cold group compared with blank control group animals; C, D: State III mice in ice-cold group compared with saline control group; E, F: Stool weight changes in blank control compared with saline control group animals. bP < 0.01 vs blank control group; dP < 0.01 vs saline control group (n = 4 for each group).
- Citation: Liang C, Wang KY, Yu Z, Xu B. Development of a novel mouse constipation model. World J Gastroenterol 2016; 22(9): 2799-2810
- URL: https://www.wjgnet.com/1007-9327/full/v22/i9/2799.htm
- DOI: https://dx.doi.org/10.3748/wjg.v22.i9.2799


