Copyright
©The Author(s) 2016.
World J Gastroenterol. Mar 7, 2016; 22(9): 2789-2798
Published online Mar 7, 2016. doi: 10.3748/wjg.v22.i9.2789
Published online Mar 7, 2016. doi: 10.3748/wjg.v22.i9.2789
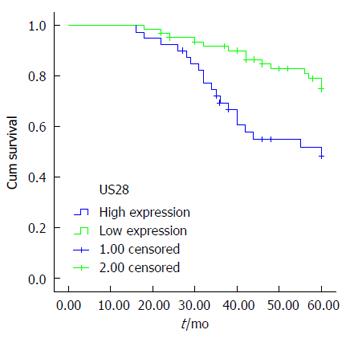
Figure 3 Kaplan-Meier survival analysis according to the US28 status (n = 103).
The Y-axis indicates the percentage of patients, and the X-axis depicts their survival in months. The green line represents patients with low US28 expression, who exhibited a trend of better survival, compared to patients with high US28 expression (indicated by the blue line) (P = 0.003). The mean overall survival (OS) time was 55.5 mo for the low US28 expression group and 47.4 mo for the high US28 expression group.
- Citation: Cai ZZ, Xu JG, Zhou YH, Zheng JH, Lin KZ, Zheng SZ, Ye MS, He Y, Liu CB, Xue ZX. Human cytomegalovirus-encoded US28 may act as a tumor promoter in colorectal cancer. World J Gastroenterol 2016; 22(9): 2789-2798
- URL: https://www.wjgnet.com/1007-9327/full/v22/i9/2789.htm
- DOI: https://dx.doi.org/10.3748/wjg.v22.i9.2789


