Copyright
©The Author(s) 2016.
World J Gastroenterol. Feb 28, 2016; 22(8): 2512-2523
Published online Feb 28, 2016. doi: 10.3748/wjg.v22.i8.2512
Published online Feb 28, 2016. doi: 10.3748/wjg.v22.i8.2512
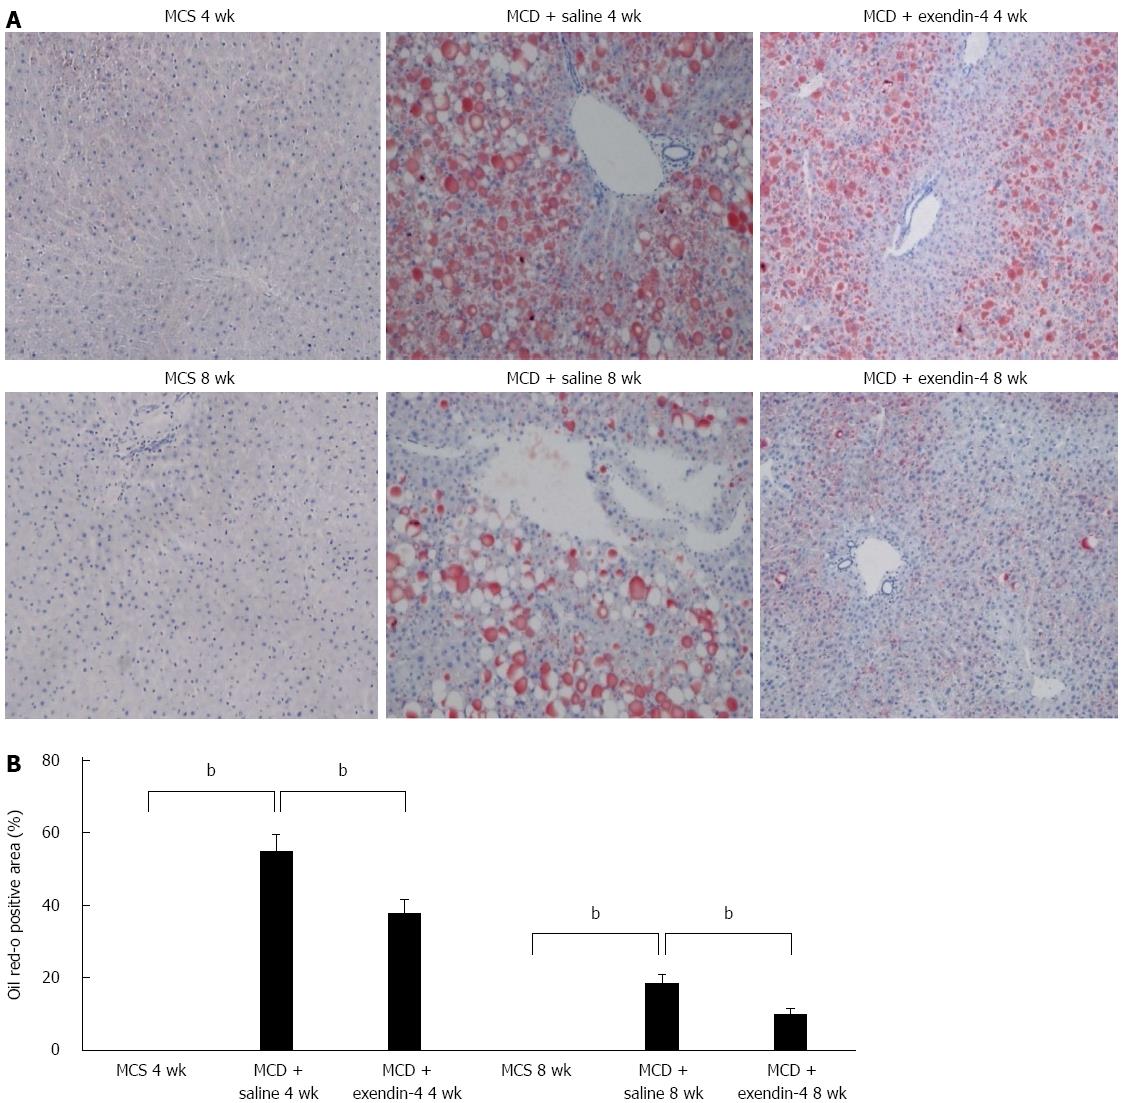
Figure 2 Evaluation of hepatic lipid contents of mice fed mice fed methionine-choline-sufficient diet, methionine-choline-deficient diet with exendin-4 or saline for 4 and 8 wk (A) and quantitative analysis of changes in Oil Red O positive area in respective groups (B).
Frozen liver sections were stained with Oil Red O. Data are expressed as mean ± SE. (bP < 0.01 vs respective groups). Original magnification, 100 ×. MCD: Methionine-choline-deficient diet; MCS: Mice fed methionine-choline-sufficient diet.
- Citation: Yamamoto T, Nakade Y, Yamauchi T, Kobayashi Y, Ishii N, Ohashi T, Ito K, Sato K, Fukuzawa Y, Yoneda M. Glucagon-like peptide-1 analogue prevents nonalcoholic steatohepatitis in non-obese mice. World J Gastroenterol 2016; 22(8): 2512-2523
- URL: https://www.wjgnet.com/1007-9327/full/v22/i8/2512.htm
- DOI: https://dx.doi.org/10.3748/wjg.v22.i8.2512


