Copyright
©The Author(s) 2016.
World J Gastroenterol. Feb 7, 2016; 22(5): 1919-1924
Published online Feb 7, 2016. doi: 10.3748/wjg.v22.i5.1919
Published online Feb 7, 2016. doi: 10.3748/wjg.v22.i5.1919
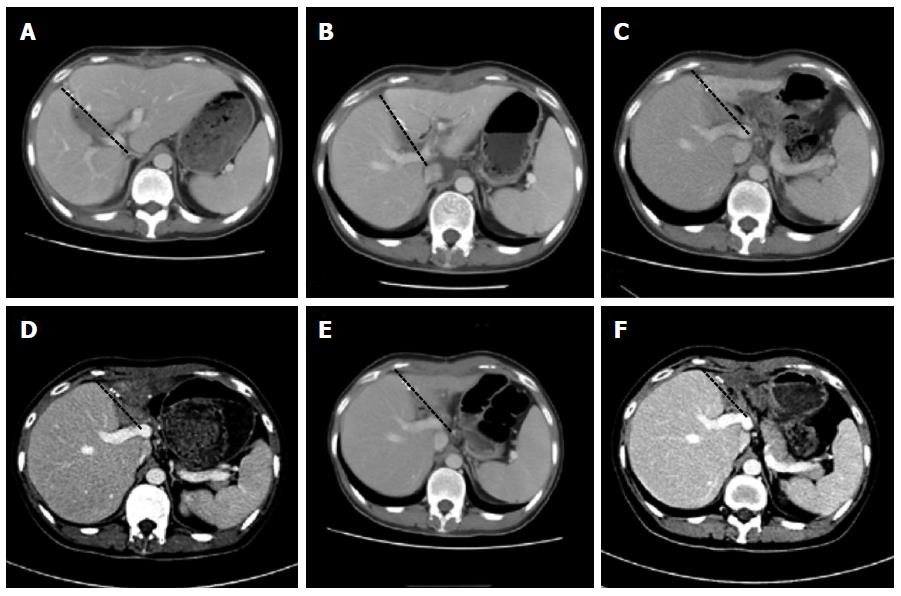
Figure 2 Serial computed tomographic findings of the native liver and graft.
The volume of the native right liver (on the left side of the black dotted line) in the recipient serially increased and the volume of the graft (on the right side of the black dotted line) notably decreased after transplantation (A-F). The CT scans were performed on posttransplant day 28 (A), 132 (B), 182 (C), 222 (D), 365 (E), and 567 (F), respectively. CT: Computed tomography.
- Citation: Duan WD, Wang XT, Wang HG, Ji WB, Li H, Dong JH. Auxiliary partial liver transplantation for acute liver failure using "high risk" grafts: Case report. World J Gastroenterol 2016; 22(5): 1919-1924
- URL: https://www.wjgnet.com/1007-9327/full/v22/i5/1919.htm
- DOI: https://dx.doi.org/10.3748/wjg.v22.i5.1919


