Copyright
©The Author(s) 2016.
World J Gastroenterol. Dec 28, 2016; 22(48): 10532-10544
Published online Dec 28, 2016. doi: 10.3748/wjg.v22.i48.10532
Published online Dec 28, 2016. doi: 10.3748/wjg.v22.i48.10532
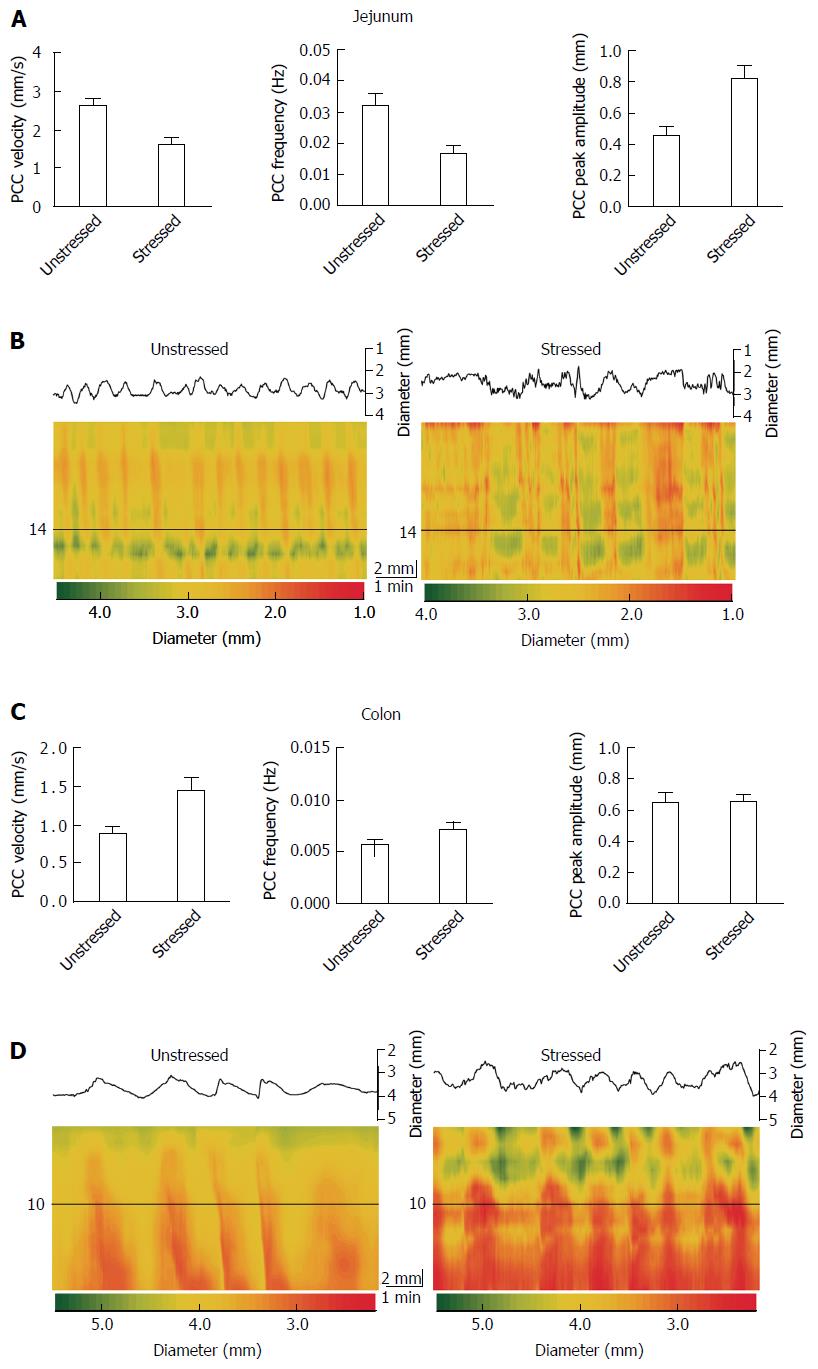
Figure 1 Effects of acute restraint stress on gut contractility, ex vivo.
A and C: Plot PCC velocity, frequency, and peak amplitude in the jejunum and colon respectively. The bar graphs show the mean difference between the control and treatment parameters. Stress decreased PCC velocity (P < 0.001) and frequency (P < 0.001) and increased peak amplitude in the jejunum (P < 0.001). Stress increased PCC velocity (P < 0.001) and frequency (P = 0.008), but had virtually no effect on peak amplitude in the colon (P = 0.902); B and D: Spatiotemporal diameter maps demonstrating contractility of the gut over time. The colour scale of the heat maps denote gut diameter starting from red for the smallest diameter (contraction) to green for the largest diameter (relaxation). The contractions run orally to anally across the vertical axis, and across time along the horizontal axis. Above the heat map is a plot of diameter vs time or a single time-point along the vertical (oral-anal) axis, which is denoted by the horizontal line. The total vertical length of the map is 20 mm and time is 480 s for the jejunum and 560 s for the colon. The scale bar measures 1 min (60 s) horizontally and 2 mm vertically. All subsequent spatiotemporal (Dmaps) followed the same parameters.
- Citation: West C, Stanisz AM, Wong A, Kunze WA. Effects of Saccharomyces cerevisiae or boulardii yeasts on acute stress induced intestinal dysmotility. World J Gastroenterol 2016; 22(48): 10532-10544
- URL: https://www.wjgnet.com/1007-9327/full/v22/i48/10532.htm
- DOI: https://dx.doi.org/10.3748/wjg.v22.i48.10532


