Copyright
©The Author(s) 2016.
World J Gastroenterol. Dec 14, 2016; 22(46): 10166-10179
Published online Dec 14, 2016. doi: 10.3748/wjg.v22.i46.10166
Published online Dec 14, 2016. doi: 10.3748/wjg.v22.i46.10166
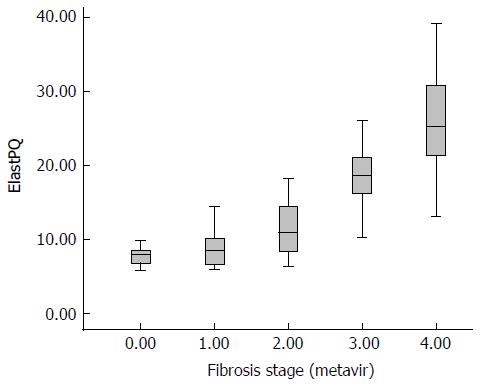
Figure 3 Boxplot shows the elastography point quantification results for each fibrosis stage.
The top and bottom of the boxes are the first and third quartiles, respectively. Accordingly, the length of the box plot represents the interquartile range within which 50% of the values were located. The lines through the middle of the boxes indicate the median values. ElastPQ: Elastography point quantification.
- Citation: Wang MJ, Ling WW, Wang H, Meng LW, Cai H, Peng B. Non-invasive evaluation of liver stiffness after splenectomy in rabbits with CCl4-induced liver fibrosis. World J Gastroenterol 2016; 22(46): 10166-10179
- URL: https://www.wjgnet.com/1007-9327/full/v22/i46/10166.htm
- DOI: https://dx.doi.org/10.3748/wjg.v22.i46.10166


