Copyright
©The Author(s) 2016.
World J Gastroenterol. Dec 14, 2016; 22(46): 10166-10179
Published online Dec 14, 2016. doi: 10.3748/wjg.v22.i46.10166
Published online Dec 14, 2016. doi: 10.3748/wjg.v22.i46.10166
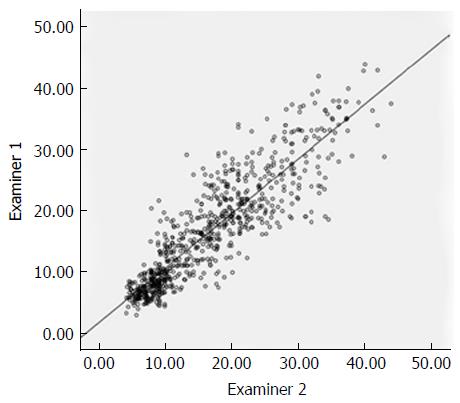
Figure 2 Graph shows correlation of elastography point quantification results between two examiners (ICC value of 0.
888, r2 = 0.788, P < 0.05).
- Citation: Wang MJ, Ling WW, Wang H, Meng LW, Cai H, Peng B. Non-invasive evaluation of liver stiffness after splenectomy in rabbits with CCl4-induced liver fibrosis. World J Gastroenterol 2016; 22(46): 10166-10179
- URL: https://www.wjgnet.com/1007-9327/full/v22/i46/10166.htm
- DOI: https://dx.doi.org/10.3748/wjg.v22.i46.10166


