Copyright
©The Author(s) 2016.
World J Gastroenterol. Dec 7, 2016; 22(45): 9984-9993
Published online Dec 7, 2016. doi: 10.3748/wjg.v22.i45.9984
Published online Dec 7, 2016. doi: 10.3748/wjg.v22.i45.9984
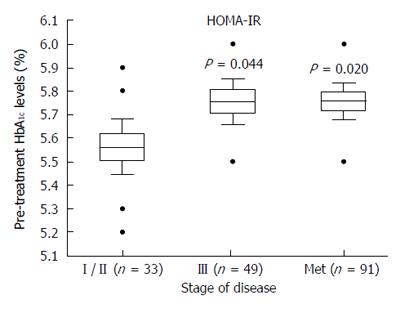
Figure 1 Box-plot of HbA1c value distribution in non-diabetic colorectal cancer patients (n = 173) according to stages of disease.
Solid lines: Mean values; boxes: Standard error; whiskers: 95%CI; closed circles: Outliers (Anova test including outliers: F = 3.9, P = 0.021).
- Citation: Ferroni P, Formica V, Della-Morte D, Lucchetti J, Spila A, D'Alessandro R, Riondino S, Guadagni F, Roselli M. Prognostic value of glycated hemoglobin in colorectal cancer. World J Gastroenterol 2016; 22(45): 9984-9993
- URL: https://www.wjgnet.com/1007-9327/full/v22/i45/9984.htm
- DOI: https://dx.doi.org/10.3748/wjg.v22.i45.9984


