Copyright
©The Author(s) 2016.
World J Gastroenterol. Nov 28, 2016; 22(44): 9765-9774
Published online Nov 28, 2016. doi: 10.3748/wjg.v22.i44.9765
Published online Nov 28, 2016. doi: 10.3748/wjg.v22.i44.9765
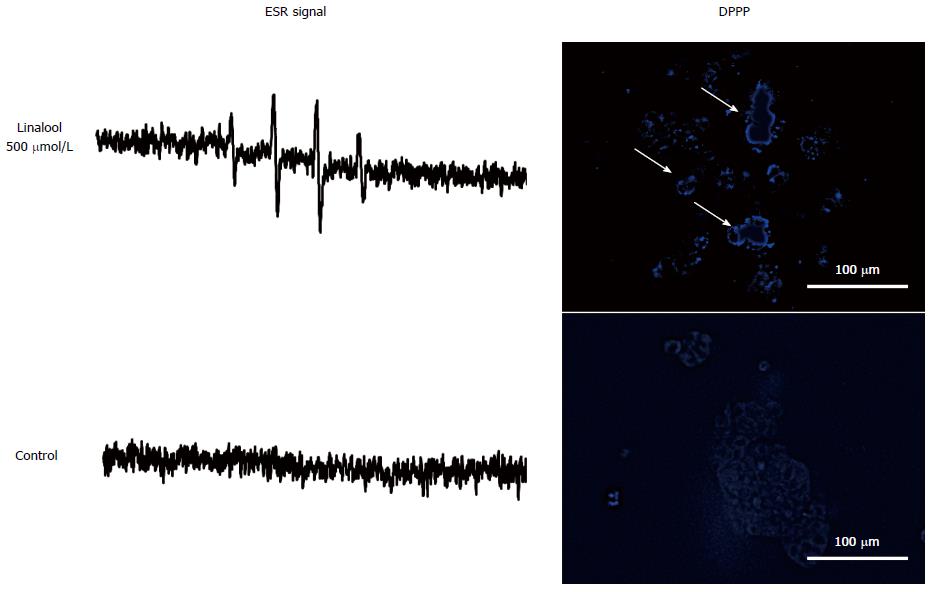
Figure 4 Oxidative stress assay in vitro.
A: Electron spin resonance (ESR) spectroscopy performed 30 min after linalool treatment. The signal intensity of 1:2:2:1 suggests generation of hydroxyl radical, the strongest reactive oxygen species (ROS); B: The signal of HCT 116 without linalool at the same time period; C: Diphenyl-1-pyrenylphosphine (DPPP) assay performed to detect lipid peroxidation showed that linalool induced cell membrane lipid peroxidation as green fluorescent on the cell surface(white arrow); D: The cell membrane lipid peroxidation was not observed in without linalool treatment group.
- Citation: Iwasaki K, Zheng YW, Murata S, Ito H, Nakayama K, Kurokawa T, Sano N, Nowatari T, Villareal MO, Nagano YN, Isoda H, Matsui H, Ohkohchi N. Anticancer effect of linalool via cancer-specific hydroxyl radical generation in human colon cancer. World J Gastroenterol 2016; 22(44): 9765-9774
- URL: https://www.wjgnet.com/1007-9327/full/v22/i44/9765.htm
- DOI: https://dx.doi.org/10.3748/wjg.v22.i44.9765


