Copyright
©The Author(s) 2016.
World J Gastroenterol. Nov 28, 2016; 22(44): 9765-9774
Published online Nov 28, 2016. doi: 10.3748/wjg.v22.i44.9765
Published online Nov 28, 2016. doi: 10.3748/wjg.v22.i44.9765
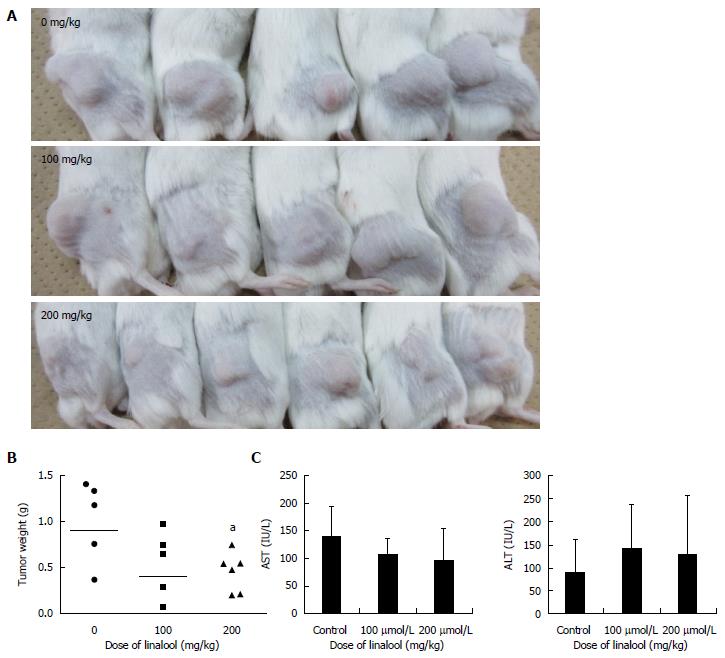
Figure 3 Changes in mouse tumor size and weight after drug administration.
A: The pictures show the size of the tumors in each group. Upper: control group. Middle: 100 mg/kg linalool group. Lower: 200 mg/kg linalool group. As concentration of linalool increased, the xenografted tumor size decreased macroscopically; B: Tumor weight after removal showed a significant decrease in the group of 200 mg/kg administration, compared to that of control group [expressed as geometric mean, n = 5 (control), 5 (100 mg/kg linalool), 6 (200 mg/kg linalool)], aP < 0.05 vs control group; one-way ANOVA followed by Dunnett’s test); C: No significant change was detected in serum AST and ALT level in each group; values are expressed as mean ± SD, n = 5 (control), 5 (100 mg/kg linalool), 6 (200 mg/kg linalool).
- Citation: Iwasaki K, Zheng YW, Murata S, Ito H, Nakayama K, Kurokawa T, Sano N, Nowatari T, Villareal MO, Nagano YN, Isoda H, Matsui H, Ohkohchi N. Anticancer effect of linalool via cancer-specific hydroxyl radical generation in human colon cancer. World J Gastroenterol 2016; 22(44): 9765-9774
- URL: https://www.wjgnet.com/1007-9327/full/v22/i44/9765.htm
- DOI: https://dx.doi.org/10.3748/wjg.v22.i44.9765


