Copyright
©The Author(s) 2016.
World J Gastroenterol. Nov 28, 2016; 22(44): 9734-9743
Published online Nov 28, 2016. doi: 10.3748/wjg.v22.i44.9734
Published online Nov 28, 2016. doi: 10.3748/wjg.v22.i44.9734
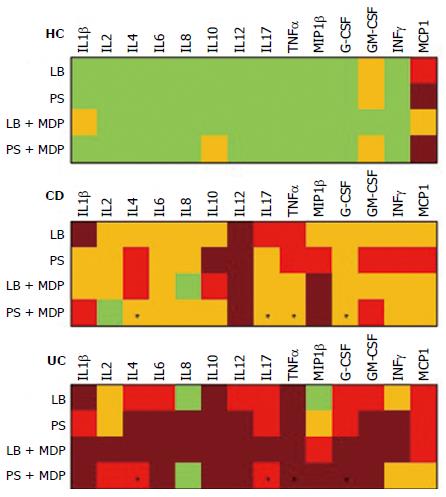
Figure 3 Color analog scale representing the median levels of all cytokines analyzed.
Median levels of all cytokines in healthy controls (HC), Crohn’s disease (CD) and ulcerative colitis (UC) groups in the four experimental conditions: live bacteria (LB), antibiotics (PS), live bacteria + Muramyl dipeptide (LB + MDP) and antibiotics + MDP (PS + MDP). For each cytokine, values 0-24% of the higher value are displayed in green, 25%-49% in orange, 50%-74% in red and above 75% in dark red. Asterisks indicate the set of cytokines whose measure allowed to discriminate CD from UC with 92% sensitivity and 50% specificity.
- Citation: Loganes C, Valencic E, Pin A, Marini E, Martelossi S, Naviglio S, De Leo L, Not T, Monasta L, Tommasini A, Marcuzzi A. Ex vivo response to mucosal bacteria and muramyl dipeptide in inflammatory bowel disease. World J Gastroenterol 2016; 22(44): 9734-9743
- URL: https://www.wjgnet.com/1007-9327/full/v22/i44/9734.htm
- DOI: https://dx.doi.org/10.3748/wjg.v22.i44.9734


