Copyright
©The Author(s) 2016.
World J Gastroenterol. Nov 21, 2016; 22(43): 9604-9612
Published online Nov 21, 2016. doi: 10.3748/wjg.v22.i43.9604
Published online Nov 21, 2016. doi: 10.3748/wjg.v22.i43.9604
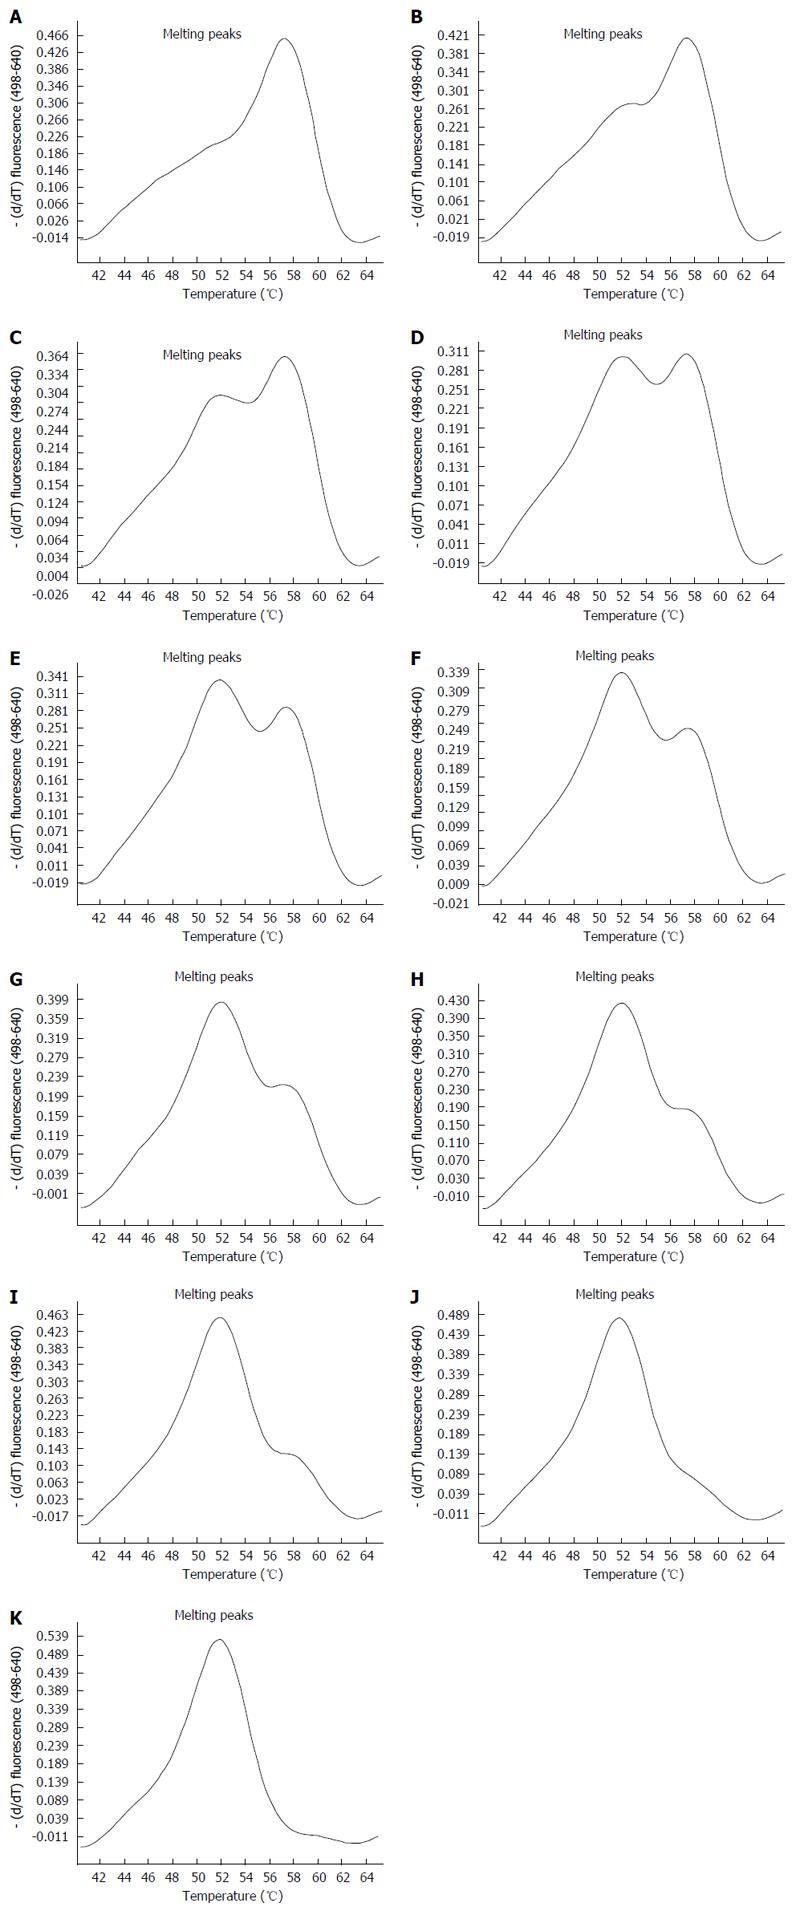
Figure 3 Melting peaks of mixtures carrying the Q and K variants analyzed by real-time technology.
The variations seen in the peak patterns are proportional to their content of variants (Q or K). Samples carrying the mutated variant can be easily identified, with a limit of detection of 10%. A: 100%K; B: 90%K/10%Q; C: 80%K/20%Q; D: 70%K/30%Q; E: 60%K/40%Q; F: 50%K/50%Q; G: 40%K/60%Q; H: 30%K/70%Q; I: 20%K/80%Q; J: 10%K/90%Q; K: 100%Q.
- Citation: Chen Q, Belmonte I, Buti M, Nieto L, Garcia-Cehic D, Gregori J, Perales C, Ordeig L, Llorens M, Soria ME, Esteban R, Esteban JI, Rodriguez-Frias F, Quer J. New real-time-PCR method to identify single point mutations in hepatitis C virus. World J Gastroenterol 2016; 22(43): 9604-9612
- URL: https://www.wjgnet.com/1007-9327/full/v22/i43/9604.htm
- DOI: https://dx.doi.org/10.3748/wjg.v22.i43.9604


