Copyright
©The Author(s) 2016.
World J Gastroenterol. Nov 21, 2016; 22(43): 9534-9543
Published online Nov 21, 2016. doi: 10.3748/wjg.v22.i43.9534
Published online Nov 21, 2016. doi: 10.3748/wjg.v22.i43.9534
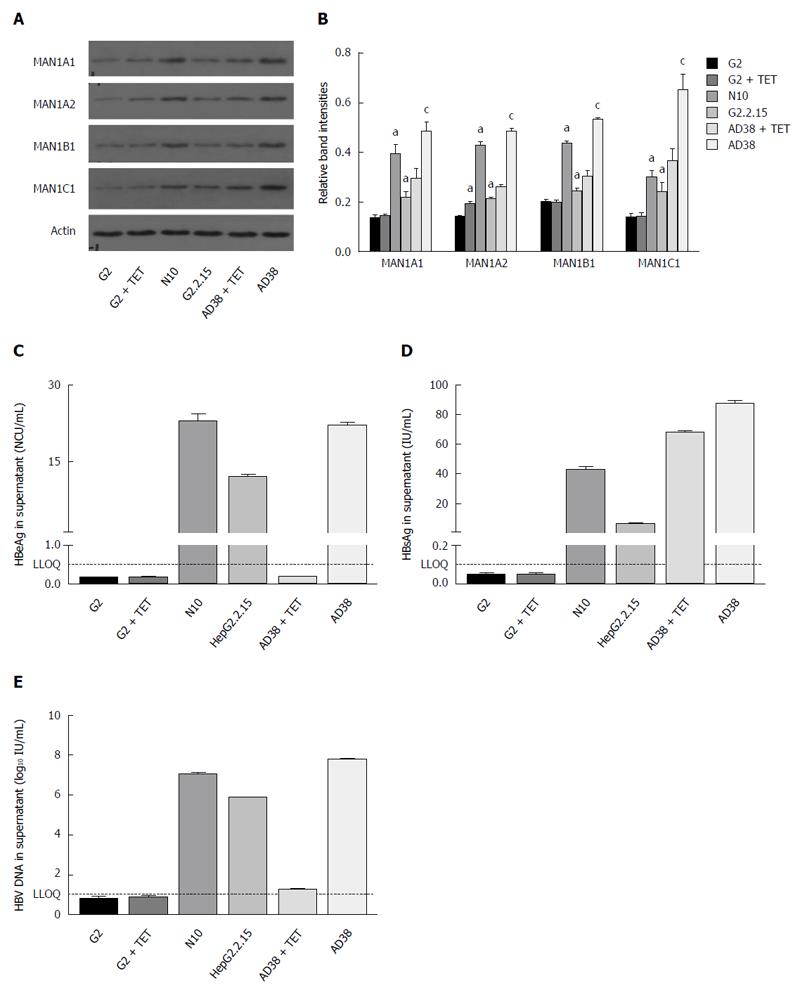
Figure 1 α-1,2-mannosidase expression and the replication and viral protein expression profiles in hepatitis B virus stably transfected cells.
A: Western blot indicating that α-1,2-mannosidase expression is significantly increased in all HBV stably transfected cells; B: Quantification of the band intensities normalized by ACTIN is shown. MAN1A1, MANA2, MAN1B1, and MAN1C1 protein levels in the HepG2.2.15 and N10 cell lines with stable HBV transfection were higher than in HepG2 cells. The α-1,2-mannosidase expression in the AD38 cells without Tet was higher than in cells with Tet. The data shown represent the mean ± SD of three independent experiments. aP < 0.05 vs HepG2 controls; cP < 0.05 vs AD38 cell line treated with TET. Secretion of HBeAg (C), HBsAg (D) and HBV-DNA (E) in the cell culture supernatant of various HBV cell lines. LLOQ: Lower limit of quantification.
- Citation: Hu S, Jiang LB, Zou XJ, Yi W, Tian DY. Hepatitis B virus upregulates host expression of α-1,2-mannosidases via the PPARα pathway. World J Gastroenterol 2016; 22(43): 9534-9543
- URL: https://www.wjgnet.com/1007-9327/full/v22/i43/9534.htm
- DOI: https://dx.doi.org/10.3748/wjg.v22.i43.9534


