Copyright
©The Author(s) 2016.
World J Gastroenterol. Nov 21, 2016; 22(43): 9525-9533
Published online Nov 21, 2016. doi: 10.3748/wjg.v22.i43.9525
Published online Nov 21, 2016. doi: 10.3748/wjg.v22.i43.9525
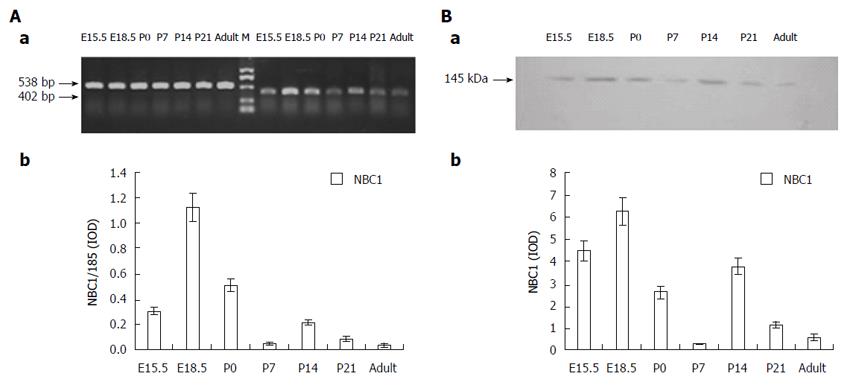
Figure 1 NBC1 mRNA expression at different developmental stages of rat pancreas measured by reverse transcription polymerase chain reaction (A) and analysis of Western blot data delineating NBC1 expression in different developmental stages of rat pancreas (B).
A: From E15.5 to adult rat, NBC1 expression in pancreas shows a biphasic expression pattern with high expression at E18.5 and P14 but low expression at P7 and adult rat. M: Marker (a); NBC1 expression profile was analyzed and normalized by 18S rRNA (b); B: The data reveals similar bands with molecular weight of about 145 kDa in samples from E15.5 to adult rat. The position of molecular weight markers are indicated on the left (a); The expression pattern of NBC1 is dynamic during rat pancreas development (b). We performed densitometric analysis of each band in all pancreatic sample lanes using the Syngenetool gel analysis software. Results are expressed as the IOD (integral optic density) of single bands in each sample. Values presented are means ± standard deviation of 3 determinations. The level of NBC1 was high at embryonic day (E)18.5 and postnatal day (P)14, but low at P7 and adult stages.
- Citation: Cao LH, Xia CC, Shi ZC, Wang N, Gu ZH, Yu LZ, Wan Q, De W. Na+/HCO3- cotransporter is expressed on β and α cells during rat pancreatic development. World J Gastroenterol 2016; 22(43): 9525-9533
- URL: https://www.wjgnet.com/1007-9327/full/v22/i43/9525.htm
- DOI: https://dx.doi.org/10.3748/wjg.v22.i43.9525


