Copyright
©The Author(s) 2016.
World J Gastroenterol. Oct 28, 2016; 22(40): 8956-8966
Published online Oct 28, 2016. doi: 10.3748/wjg.v22.i40.8956
Published online Oct 28, 2016. doi: 10.3748/wjg.v22.i40.8956
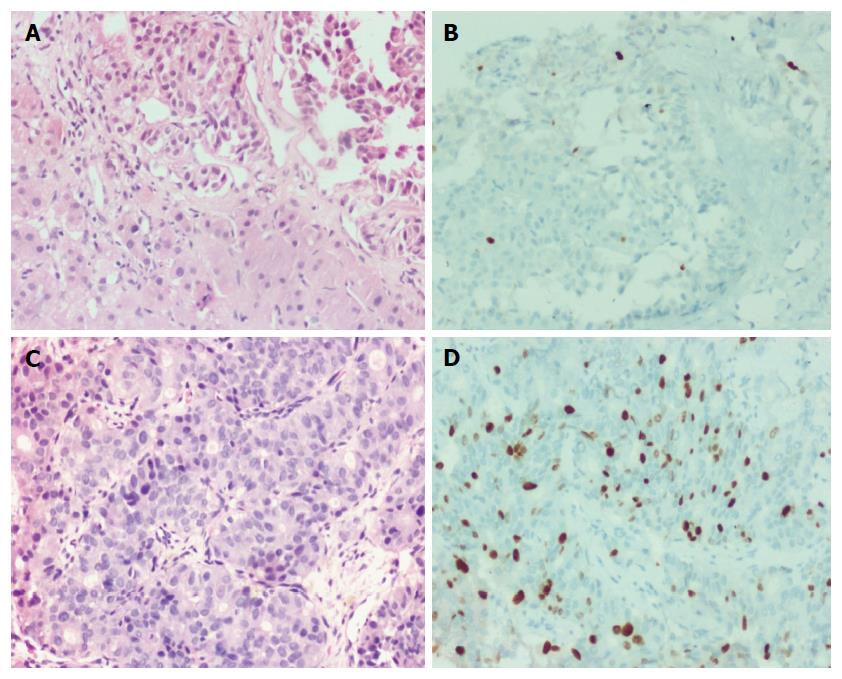
Figure 3 D1/D2 and D2/D3 neuroendocrine neoplasms.
A: D1/2 - liver biopsy showing clusters of tumor cells with uniform nuclei and no conspicuous mitotic activity (H&E × 200); B: Tumor cells displaying Ki-67 index of approximately 5% (immunohistochemistry × 200); C: D2/D3 shows tumor cells arranged in trabeculae and focal acinar pattern with mildly pleomorphic nuclei (H&E × 200); D: Tumor cells displaying Ki-67 index of approximately 30% (immunohistochemistry × 200).
- Citation: Burad DK, Kodiatte TA, Rajeeb SM, Goel A, Eapen CE, Ramakrishna B. Neuroendocrine neoplasms of liver - A 5-year retrospective clinico-pathological study applying World Health Organization 2010 classification. World J Gastroenterol 2016; 22(40): 8956-8966
- URL: https://www.wjgnet.com/1007-9327/full/v22/i40/8956.htm
- DOI: https://dx.doi.org/10.3748/wjg.v22.i40.8956


