Copyright
©The Author(s) 2016.
World J Gastroenterol. Oct 28, 2016; 22(40): 8918-8928
Published online Oct 28, 2016. doi: 10.3748/wjg.v22.i40.8918
Published online Oct 28, 2016. doi: 10.3748/wjg.v22.i40.8918
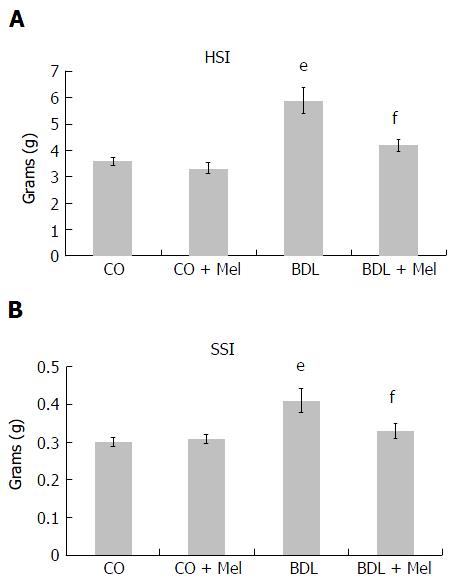
Figure 2 Mean hepatosomatic and splenosomatic index values in the different experimental groups.
All results are expressed as mean ± SD error. Significant difference existed between the BDL and control groups (CO and CO + Mel) (eP < 0.001). Significant difference existed between the BDL and BDL + Mel groups (fP < 0.001). CO: Control; CO + Mel: Control + melatonin; BDL: Bile duct ligation; BDL + Mel: Bile duct ligation + melatonin; HSI: Hepatosomatic index; SSI: Splenosomatic index.
- Citation: Colares JR, Schemitt EG, Hartmann RM, Licks F, Soares MDC, Bosco AD, Marroni NP. Antioxidant and anti-inflammatory action of melatonin in an experimental model of secondary biliary cirrhosis induced by bile duct ligation. World J Gastroenterol 2016; 22(40): 8918-8928
- URL: https://www.wjgnet.com/1007-9327/full/v22/i40/8918.htm
- DOI: https://dx.doi.org/10.3748/wjg.v22.i40.8918


