Copyright
©The Author(s) 2016.
World J Gastroenterol. Jan 28, 2016; 22(4): 1541-1550
Published online Jan 28, 2016. doi: 10.3748/wjg.v22.i4.1541
Published online Jan 28, 2016. doi: 10.3748/wjg.v22.i4.1541
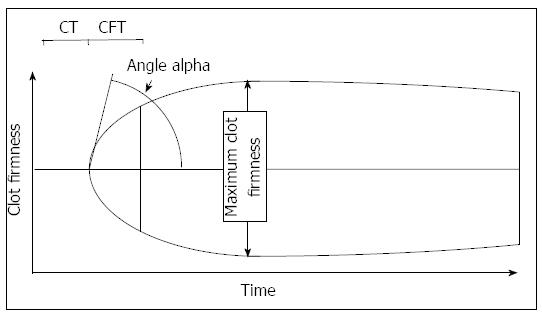
Figure 2 Thrombelastometry variables most often used to interpretate a tracing.
The thrombelastogram shows the firmness of a clot during the measurement time. The clotting time is defined as the time from recalcification and activation of blood samples to the onset of coagulation. The maximum clot firmness describes the physical properties of a clot, which is defined by platelet count and fibrinogen concentration. The α angle and the clot formation time describe the kinetics of clot generation.
- Citation: Hartmann M, Szalai C, Saner FH. Hemostasis in liver transplantation: Pathophysiology, monitoring, and treatment. World J Gastroenterol 2016; 22(4): 1541-1550
- URL: https://www.wjgnet.com/1007-9327/full/v22/i4/1541.htm
- DOI: https://dx.doi.org/10.3748/wjg.v22.i4.1541


