Copyright
©The Author(s) 2016.
World J Gastroenterol. Oct 21, 2016; 22(39): 8760-8769
Published online Oct 21, 2016. doi: 10.3748/wjg.v22.i39.8760
Published online Oct 21, 2016. doi: 10.3748/wjg.v22.i39.8760
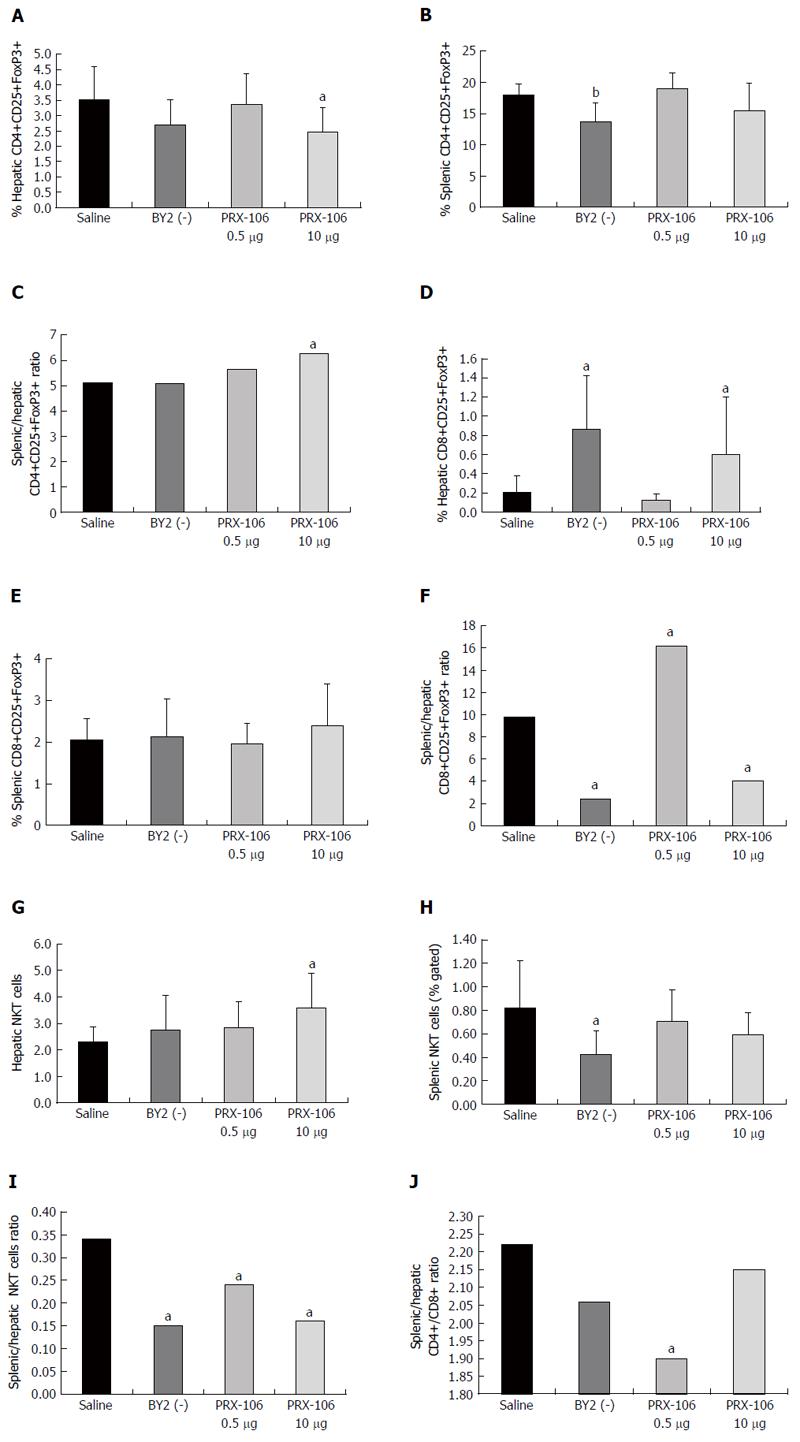
Figure 1 FACS analysis was performed on lymphocytes harvested from the spleens and livers of all mice from the experimental and control groups.
The results were compared for the following subsets of cells. A: Intrahepatic CD4+CD25+FoxP3+ lymphocytes; B: Intrasplenic CD4+CD25+FoxP3+ lymphocytes; C: The intrasplenic-to-intrahepatic CD4+CD25+FoxP3+ ratio was calculated; D: Intrahepatic CD8+CD25+FoxP3+ lymphocytes; E: Intrasplenic CD8+CD25+FoxP3+ lymphocytes; F: The intrasplenic-to-intrahepatic CD8+CD25+FoxP3+ ratio was calculated; G: Intrahepatic NKT lymphocytes; H: Intrasplenic NKT lymphocytes; I: The intrasplenic-to-intrahepatic NKT ratio was calculated; J: To determine the effect of the treatment on the lymphocyte trapping in the liver, the CD4/CD8 lymphocyte ratio was calculated in the spleen and in the liver. The ratio between the splenic and hepatic CD4/CD8 ratios was calculated. aP < 0.05, bP < 0.01.
- Citation: Ilan Y, Ben Ya'acov A, Shabbat Y, Gingis-Velitski S, Almon E, Shaaltiel Y. Oral administration of a non-absorbable plant cell-expressed recombinant anti-TNF fusion protein induces immunomodulatory effects and alleviates nonalcoholic steatohepatitis. World J Gastroenterol 2016; 22(39): 8760-8769
- URL: https://www.wjgnet.com/1007-9327/full/v22/i39/8760.htm
- DOI: https://dx.doi.org/10.3748/wjg.v22.i39.8760


