Copyright
©The Author(s) 2016.
World J Gastroenterol. Oct 7, 2016; 22(37): 8361-8374
Published online Oct 7, 2016. doi: 10.3748/wjg.v22.i37.8361
Published online Oct 7, 2016. doi: 10.3748/wjg.v22.i37.8361
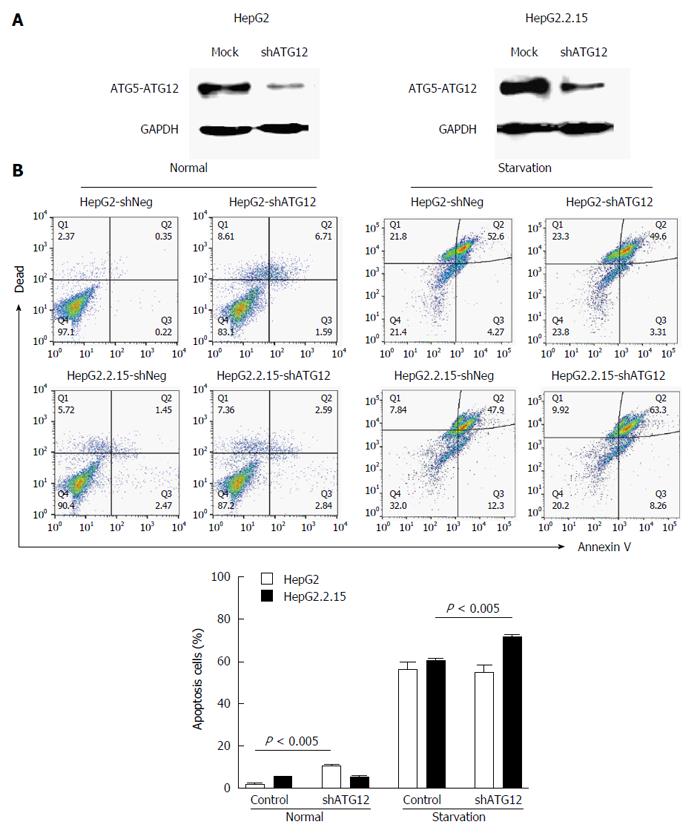
Figure 4 Apoptosis assays of HepG2 and HepG2.
2.15 cells transfected with shATG12 or shNeg (control). A: Suppression of ATG12 expression was done by RNA interference. Western blotting was used to analyze ATG12 proteins from mock treatment (control) and ATG12 knockdown (shATG12) in HepG2 and HepG2.2.15 cells; B: GAPDH was used as a protein loading control. Cells were transiently transfected with shRNA plasmids for 72 h (normal) and then cultured in EBSS for 4 h (starvation). Bar graphs show the percentage of total apoptotic cells detected by Annexin V binding. Data represent the mean and SE from three independent experiments.
- Citation: Kunanopparat A, Kimkong I, Palaga T, Tangkijvanich P, Sirichindakul B, Hirankarn N. Increased ATG5-ATG12 in hepatitis B virus-associated hepatocellular carcinoma and their role in apoptosis. World J Gastroenterol 2016; 22(37): 8361-8374
- URL: https://www.wjgnet.com/1007-9327/full/v22/i37/8361.htm
- DOI: https://dx.doi.org/10.3748/wjg.v22.i37.8361


