Copyright
©The Author(s) 2016.
World J Gastroenterol. Oct 7, 2016; 22(37): 8334-8348
Published online Oct 7, 2016. doi: 10.3748/wjg.v22.i37.8334
Published online Oct 7, 2016. doi: 10.3748/wjg.v22.i37.8334
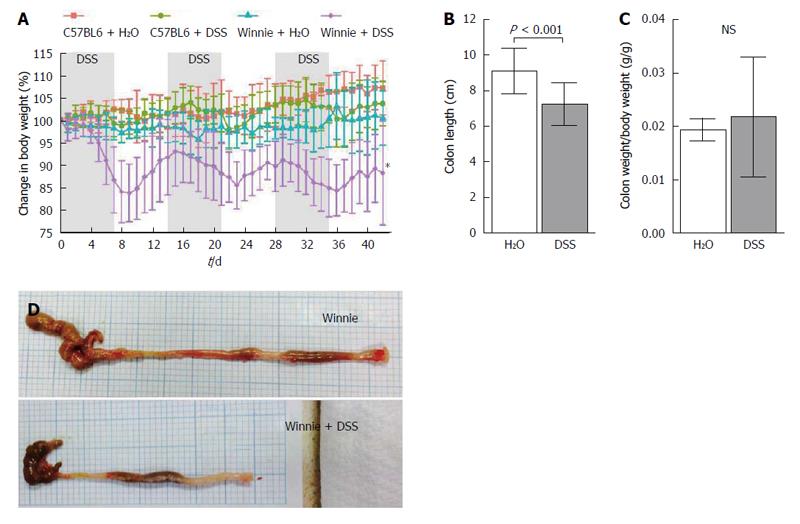
Figure 1 Clinical features of dextran sulphate sodium-induced colitis in Winnie.
A: Daily change in body weight of wild-type; B: Winnie mice during the three cycle experimental dextran sulphate sodium (DSS) regimen. Body weight was recorded each day and recorded as percentage change from the starting body weight prior to commencement of the experiment (day 0). Each point represents the mean percentage change in body weight relative to the initial body weight (n = 4). Error bars depict standard deviation (SD) from the mean. Asterisk signifies difference (P < 0.05) between control Winnie mice and Winnie mice exposed to DSS; C: Mean colon length at termination. Error bars depict SD from the mean; D: Gross appearance of the Winnie colon at termination. Representative images of Winnie colon after receiving three cycles of water only (top) and the colon of Winnie receiving three cycles of DSS (bottom).
- Citation: Randall-Demllo S, Fernando R, Brain T, Sohal SS, Cook AL, Guven N, Kunde D, Spring K, Eri R. Characterisation of colonic dysplasia-like epithelial atypia in murine colitis. World J Gastroenterol 2016; 22(37): 8334-8348
- URL: https://www.wjgnet.com/1007-9327/full/v22/i37/8334.htm
- DOI: https://dx.doi.org/10.3748/wjg.v22.i37.8334


