Copyright
©The Author(s) 2016.
World J Gastroenterol. Sep 21, 2016; 22(35): 8017-8025
Published online Sep 21, 2016. doi: 10.3748/wjg.v22.i35.8017
Published online Sep 21, 2016. doi: 10.3748/wjg.v22.i35.8017
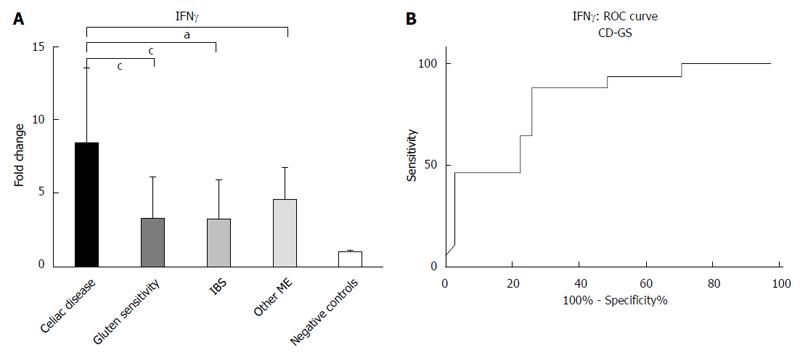
Figure 2 Pattern of mucosal expression of interferon gammaγ-mRNA in subjects with different causes of microscopic enteritis.
A: ANOVA plus Bonferroni analysis showed that CD > Other ME > GS = IBS > negative control, aP < 0.05, cP < 0.001; B: ROC curve of CD vs GS comparison is reported. ROC: Receiver operating curves.
- Citation: Losurdo G, Giorgio F, Piscitelli D, Montenegro L, Covelli C, Fiore MG, Giangaspero A, Iannone A, Principi M, Amoruso A, Barone M, Di Leo A, Ierardi E. May the assessment of baseline mucosal molecular pattern predict the development of gluten related disorders among microscopic enteritis? World J Gastroenterol 2016; 22(35): 8017-8025
- URL: https://www.wjgnet.com/1007-9327/full/v22/i35/8017.htm
- DOI: https://dx.doi.org/10.3748/wjg.v22.i35.8017


