Copyright
©The Author(s) 2016.
World J Gastroenterol. Sep 14, 2016; 22(34): 7787-7796
Published online Sep 14, 2016. doi: 10.3748/wjg.v22.i34.7787
Published online Sep 14, 2016. doi: 10.3748/wjg.v22.i34.7787
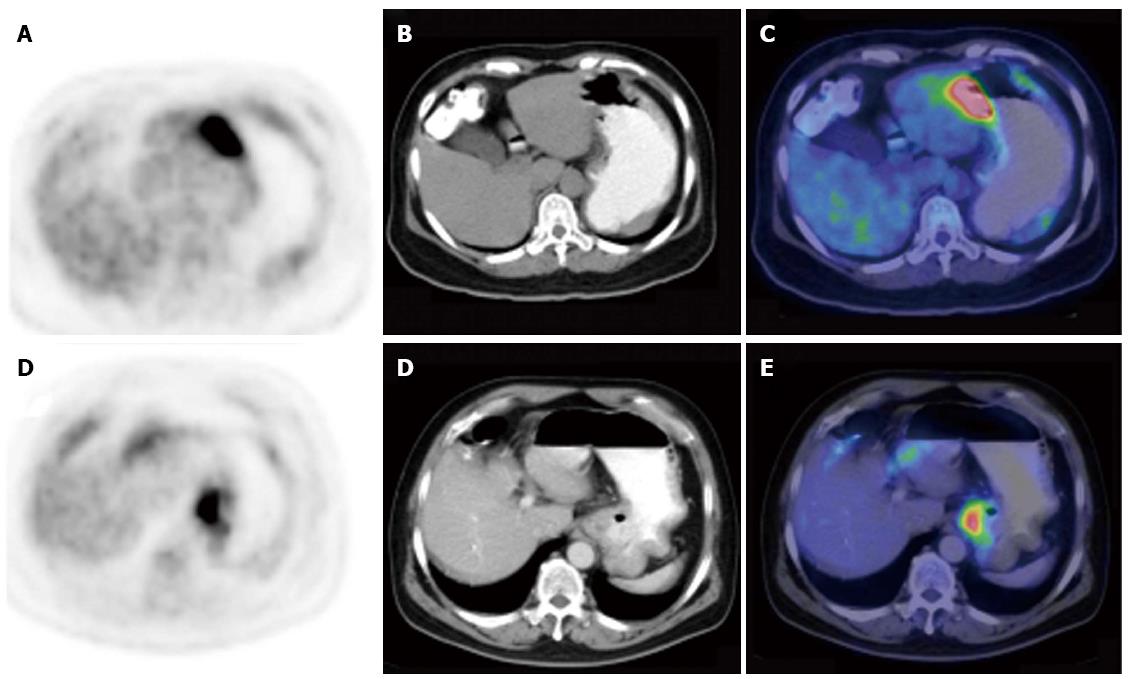
Figure 3 Comparison of gastric lymphoma and gastric carcinoma with local fluorodeoxyglucose uptake.
A-C: PET (left column), CT (middle column) and PET/CT fused images (right column) of a 54-year-old woman with DLBCL (SUVmax 13.4, THKmax 2.0 cm); D-F: A 60 year-old man with poorly differentiated gastric adenocarcinoma (SUVmax 9.1, THKmax 1.9 cm) CT: Computed tomography; PET: Positron emission tomography; SUVmax: Maximal standard uptake value; THKmax: Maximal thickness.
- Citation: Li XF, Fu Q, Dong YW, Liu JJ, Song XY, Dai D, Zuo C, Xu WG. 18F-fluorodeoxyglucose positron emission tomography/computed tomography comparison of gastric lymphoma and gastric carcinoma. World J Gastroenterol 2016; 22(34): 7787-7796
- URL: https://www.wjgnet.com/1007-9327/full/v22/i34/7787.htm
- DOI: https://dx.doi.org/10.3748/wjg.v22.i34.7787


