Copyright
©The Author(s) 2016.
World J Gastroenterol. Aug 7, 2016; 22(29): 6726-6735
Published online Aug 7, 2016. doi: 10.3748/wjg.v22.i29.6726
Published online Aug 7, 2016. doi: 10.3748/wjg.v22.i29.6726
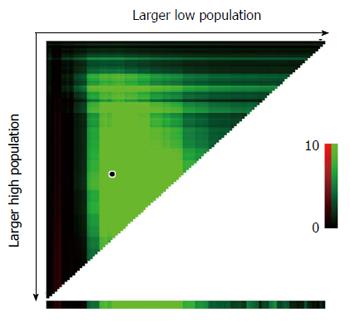
Figure 2 X-tile plots of tumor size in the Surveillance, Epidemiology and End Results cohort of patients with T4bN0-2M0 colon cancer.
The x-axis represents all potential tumor size cut-off values from low to high (left to right) that could be used to define the low subset, while the y-axis represents all potential cut-off values from high to low (top to bottom) that could be used to define the high subset. Brighter pixels indicate stronger association between tumor size and CSS. The plot showed the brightest pixel (marked by the black circle) when the study cohort was divided into high, middle, and low subsets using cut-off points of 4.0 and 7.0 cm. Green coloration indicates continuous direct association between increasing tumor size and higher CSS. CSS: CANCER-specific survival.
- Citation: Huang B, Feng Y, Mo SB, Cai SJ, Huang LY. Smaller tumor size is associated with poor survival in T4b colon cancer. World J Gastroenterol 2016; 22(29): 6726-6735
- URL: https://www.wjgnet.com/1007-9327/full/v22/i29/6726.htm
- DOI: https://dx.doi.org/10.3748/wjg.v22.i29.6726


