Copyright
©The Author(s) 2016.
World J Gastroenterol. Aug 7, 2016; 22(29): 6706-6715
Published online Aug 7, 2016. doi: 10.3748/wjg.v22.i29.6706
Published online Aug 7, 2016. doi: 10.3748/wjg.v22.i29.6706
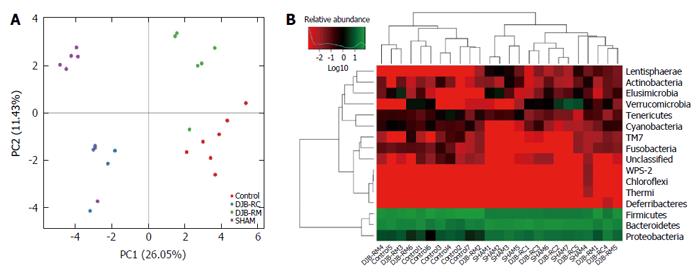
Figure 5 Principal component analysis and heatmap analysis.
A: Principal component analysis was used to construct a 2-D graph to summarize the factors mainly responsible for this difference. Similarity was high when two samples were closely located. A number in brackets represents contributions of principal components to differences among samples; B: Heat map analysis: The longitudinal clustering indicates the similarity of all species among different samples, and horizontal clustering indicates the similarity of certain species among different samples, the closer the distance and the shorter the branch length, the more similar the species composition is between the samples.
- Citation: Zhong MW, Liu SZ, Zhang GY, Zhang X, Liu T, Hu SY. Alterations in gut microbiota during remission and recurrence of diabetes after duodenal-jejunal bypass in rats. World J Gastroenterol 2016; 22(29): 6706-6715
- URL: https://www.wjgnet.com/1007-9327/full/v22/i29/6706.htm
- DOI: https://dx.doi.org/10.3748/wjg.v22.i29.6706


